Oracle / Database and APEX
Automate Migrations for Oracle APEX and Databases
global leaders Trust flexagon for end-to-end devops
VALUE. EFFICIENCY. FLEXABILITY.
Accelerate APEX app release cycles while minimizing human errors
Multiply time and cost savings with automated pipeline releases through Flexagon. It delivers native support for APEX applications, Oracle Database objects, and REST Data Services. Developers and DBAs rely on Flexagon to extend SaaS applications, enhance Oracle E-Business Suite implementations, and deliver more significant innovation.
Reduce manual errors by automating APEX application deployment
Accelerate software release with simple database objects promotion
Gain greater http capabilities with native support for Oracle REST Data Services
Lower costs with streamlined CI/CD workflows and release pipeline
Elevate capabilities and toolchain investments with built-in integrations
FlexDeploy INteractive Demo
APEX and Database users accomplish more with FlexDeploy
APEX applications support
Database objects support
REST data services
Version control integration
Test automation
Security and compliance
Customizable dashboards and insights
See what's new with Flexagon, Database, and APEX
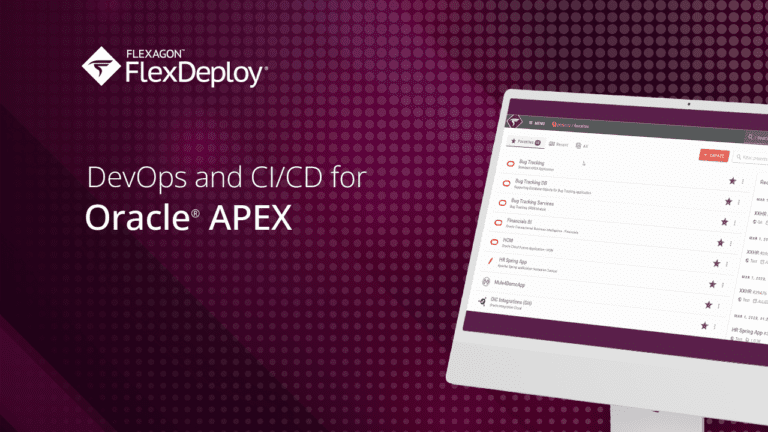
FlexDeploy for Oracle APEX
FlexDeploy expedites the advancement and deployment of Oracle APEX applications and their essential resources throughout the pipeline, seamlessly reaching production.

How Heathrow’s IT Landscape Transformed
FlexDeploy for Oracle APEX

FlexDeploy for Oracle Database


Get extensive support for configuration management, build automation, deployment automation, and release orchestration for Oracle Fusion Applications.
- Enterprise resource planning (ERP)
- Supply chain management (SCM)
- Human capital management (HCM)
- Customer experience (CX)
- Enterprise performance management (EPM)
Get comprehensive support for managing the build, deploy, and testing lifecycle for Oracle Business Intelligence and Analytics.
- Automate movement across environments
- Revert to older versions
- Reduce manual processes and minimize errors
- Increase visibility and know which versions deployed to each environment
Don’t let manual processes stop you from getting the full power of Oracle Analytics Cloud. FlexDeploy for Oracle Analytics Cloud (OAC) provides operations to manage the build and deployment of Webcatalog objects across your cloud instances. Deliver quickly, safely, and reliably by:
- Automating the migration of WebCatalog objects across various environments
- Creating complete CI/CD pipelines, integrating tests, approvals, and notifications
- Allowing users complete visibility across the lifecycle and into the state of various environments
A comprehensive solution for pipeline automation and application release management for integrations and APIs.
- Automate CI/CD for Oracle Integrations and API Gateway
- Increase visibility and control of Oracle Integration and API deployments
- Reduce time and cost of deploying Oracle integration changes
Overcome the unique challenges of extensive customizations, configurations, and ingrained ad hoc processes. Employ modern software delivery practices to:
- Replace legacy tools such as Micro Focus PPM (Kintana) and Quest Stat, reducing cost and increasing flexibility
- Increase visibility with dashboards and reports for both customizations and configurations
- Automate migration of all EBS object types—including database, forms, reports, AOL, OAF, and configurations—ensuring consistency and compliance across environments
Eliminate cumbersome code, migration, and operational processes and avoid the waiting game that causes unnecessary delays.
- Adopting CI to trigger the build and deploy process
- Automating deployment of ORDS, SODA, and supporting Database objects
- Automatically exporting APEX applications and optionally committing to Git, SVN, or other SCM
Gain the visibility and controls needed to manage and maintain your middleware implementations on-premises, cloud, or hybrid deployment architectures.
- Standardize, orchestrate, and automate the lifecycle of middleware artifacts and configurations across test and production environments
- Leverage the most extensive Fusion Middleware product support available today: WebLogic, SOA Suite, Service Bus, B2B, JMS, MFT, and OBIEE
Eliminate cumbersome code, migration, and operational processes and avoid the waiting game that causes unnecessary delays.
- Automate for increased speed and agility
- Improve software release quality and reliability
- Protect your valuable application assets
- Establish a solid CI/CD pipeline that scales as your business evolves