
Consider for a moment all the long-term, successful software companies. What variable is constant among all them that aided their success? Arguably, code quality is a key ingredient. Code quality can convert into how valuable and viable your code is: top notch code can be re-utilized and re-developed. Allowing low quality code to accumulate, often referred to as technical debt, is a great way to incur more expensive maintenance and future development. The more bad code you have, the more you will have to pay later. In the worse case, so much technical debt is built up that it’s better to scrap the application than attempt to refactor.
Moreover, development teams are under pressure. Quality releases need to be delivered on time. Coding and compliance standards need to be met. And mistakes can cost your company a pretty penny. That’s why development teams are using static analysis tools. FlexDeploy’s SonarQube plugin, introduced with FlexDeploy 5.3, is here to help you easily integrate code analysis into your software development lifecycle!
With a growing community of 120,000 users, SonarQube makes the probing of large codebases much easier and faster than ever before. It is an open source solution for continuous inspection of code quality. By performing automatic reviews with static code analysis to detect bugs, code smells, and security vulnerabilities developers can fix these issues before they become large scale problems. Not only that but SonarQube can record metric history, produce evolution graphs, make duplicate code reports, and more.
Let’s will explore how FlexDeploy’s SonarQube plugin can enhance your workflows by simply raising a hand when the quality of code base is impaired and then pointing you to the SonarQube dashboard where a full report is generated.
Operations
The SonarQube plugin provides 3 operations:
- startSonarScan
- retrieveSonarScan
- analyzeCode
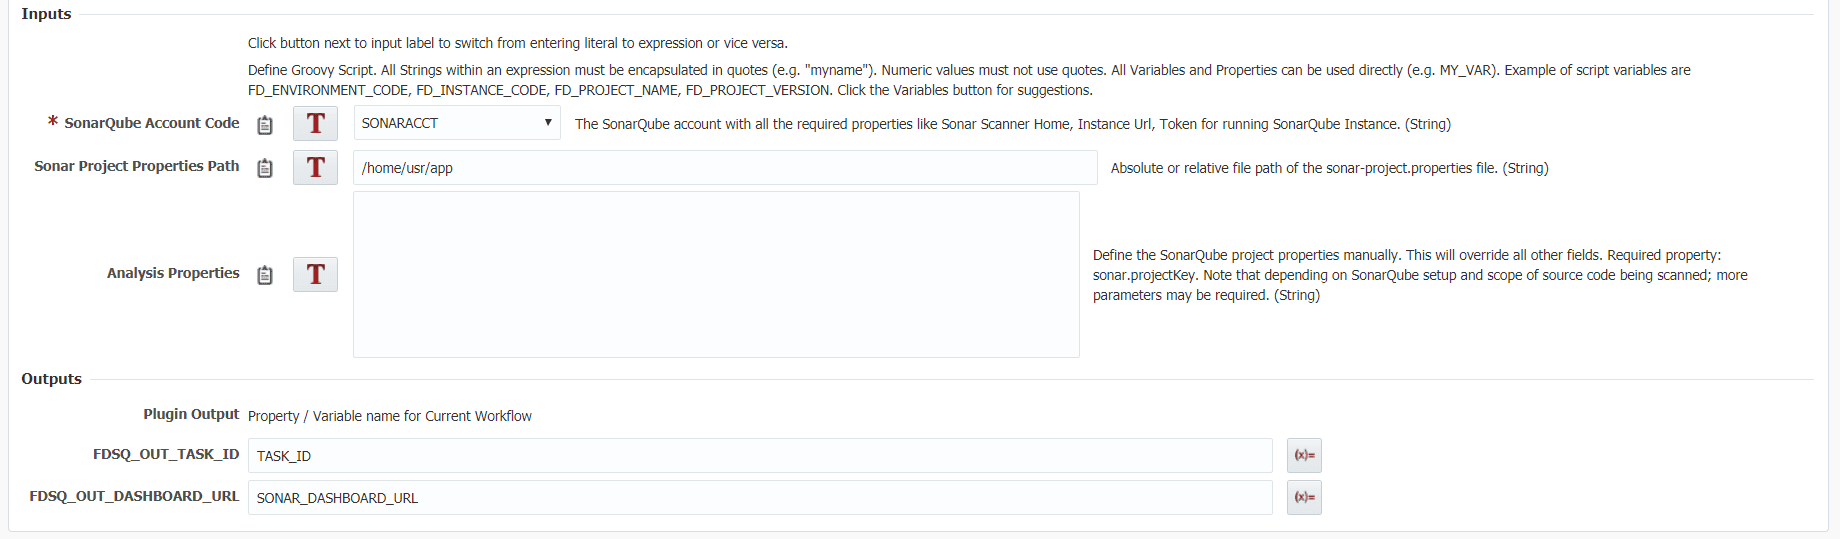
The start operation allows users to initiate a SonarQube scan without having to interact with the shell to manually begin the scan. This operation contains 3 inputs to start the scan. The analysis properties input is where all the customization for your scan will occur. For example, you can define the project name, version number, a comma separate list of source file locations, etc.. If you would like an in depth description of all the possible analysis properties check out this link.
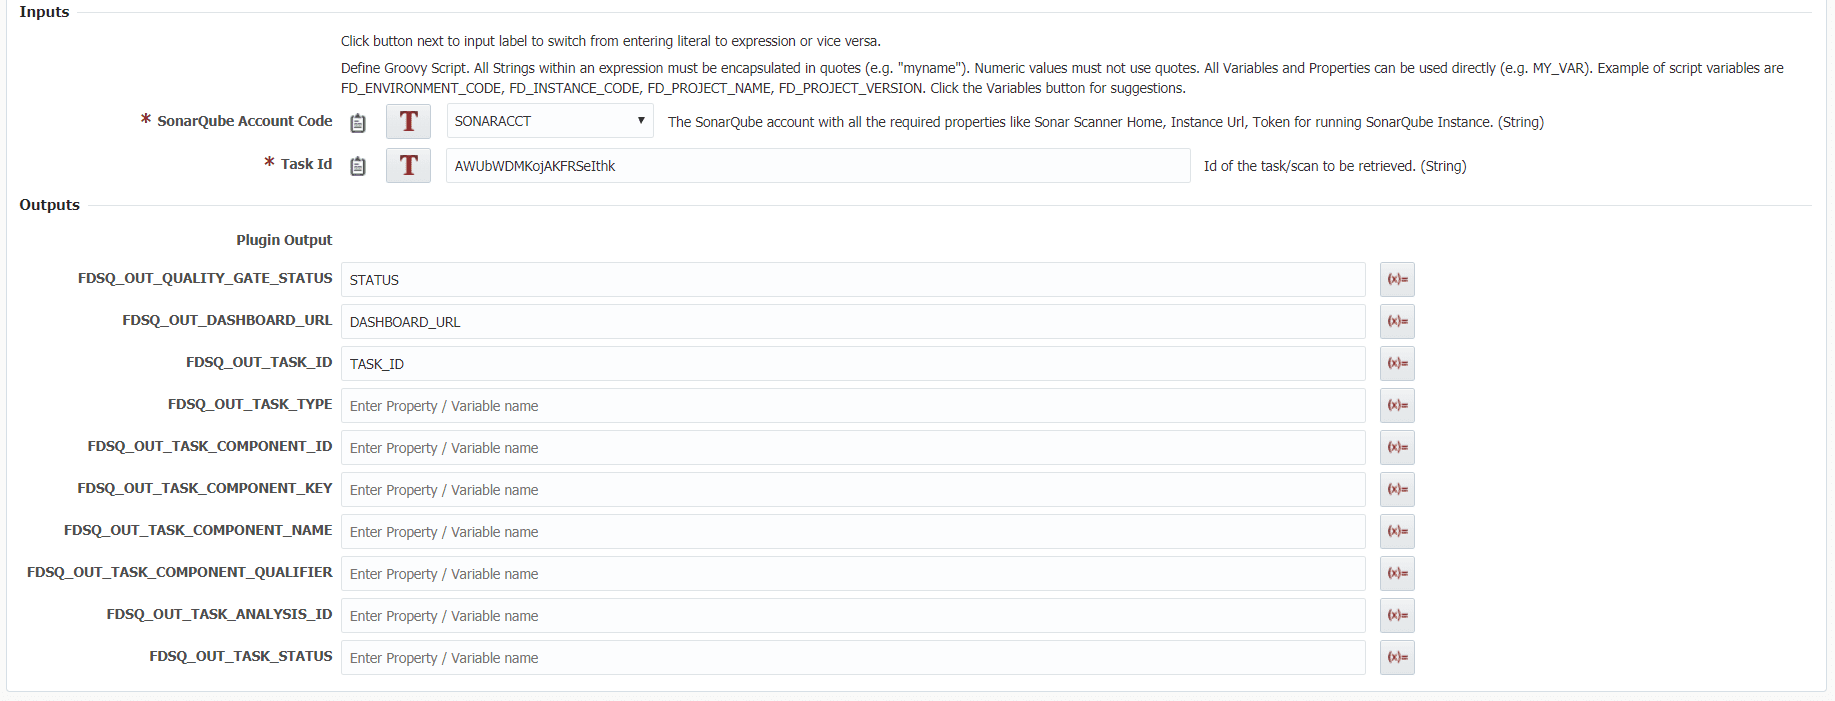
The retrieve operation allows users to retrieve basic information and a browsable link to the full report about a completed SonarQube scan. Retrieve a task id from a startSonarScan operation or on your SonarQube instance under a projects background tasks.
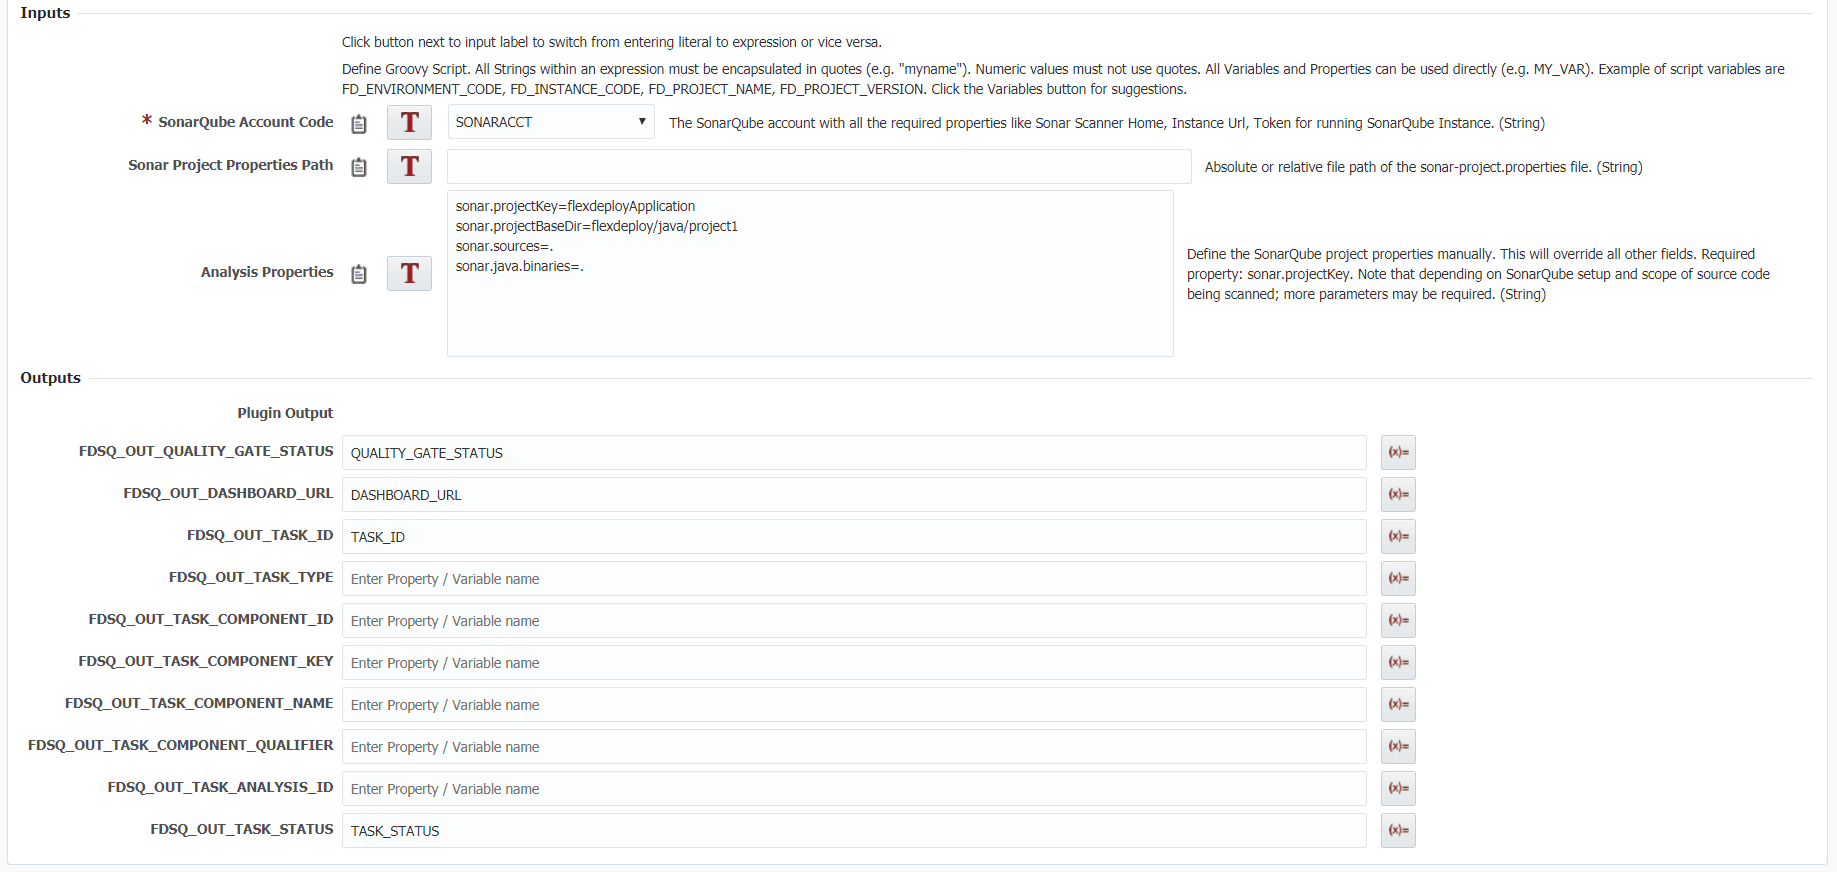
The analyze operation is essentially a start scan and retrieve in one operation. Upon execution it will run the scan and then wait until full completion and give you back the results in the same workflow execution. The inputs are identical to startSonarScan and the outputs are identical to retrieveSonarScan.
For more information on the operations and examples on how to use them in FlexDeploy check out the SonarQube plugin guide.
Start Scan
The start scan can be utilized when you would like to start a scan but don’t need the results of the scan in the current workflow execution. Say you started a scan in DEV environment, it will progress asynchronously from which you can save the task id and then in a different workflow and/or a different environment such as QA or PROD you can check on its status. For a better understanding on the inputs/outputs and how they are used in a start scan you can view more information on the SonarQube plugin guide.
Retrieve Scan
As the name suggests the retrieve scan can be used in conjunction with a start scan to check if it is complete and get results of that scan. For a better understanding on the inputs/outputs and how they are used in a retrieve scan you can view more information on the SonarQube plugin guide.
Analyze Code
In some use cases you may need to run a scan and do some operation with the results in the current workflow. For example, you could use the analyze to fail a build or deploy if the scan fails. It’s important to note that the amount of run time required is longer than both start and retrieve operations. For a better understanding on the inputs/outputs and how they are used in an analyze you can view more information on the SonarQube plugin guide.
Workflow Sample
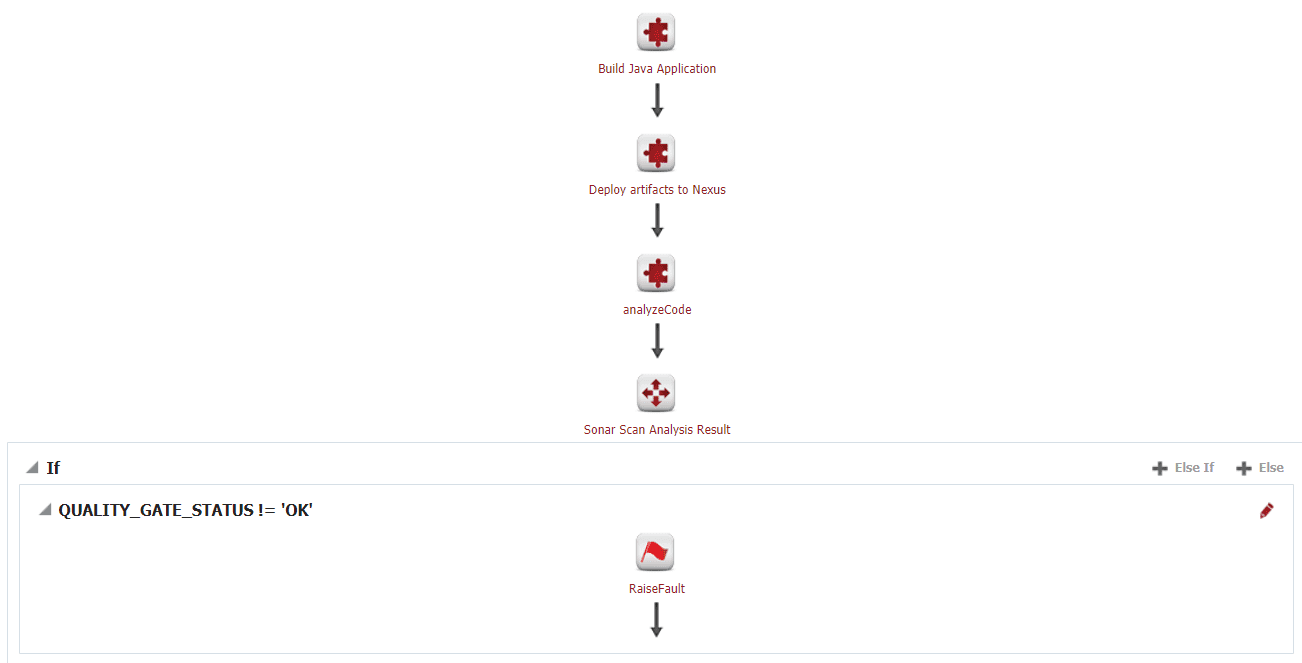
Here we have a simple JavaApplication. The workflow builds the newest version of the code base, deploys those changes to Nexus and then performs the SonarQube analysis. In this case, we don’t want the build to succeed if the scan should fail, so we are using analyzeCode operation.
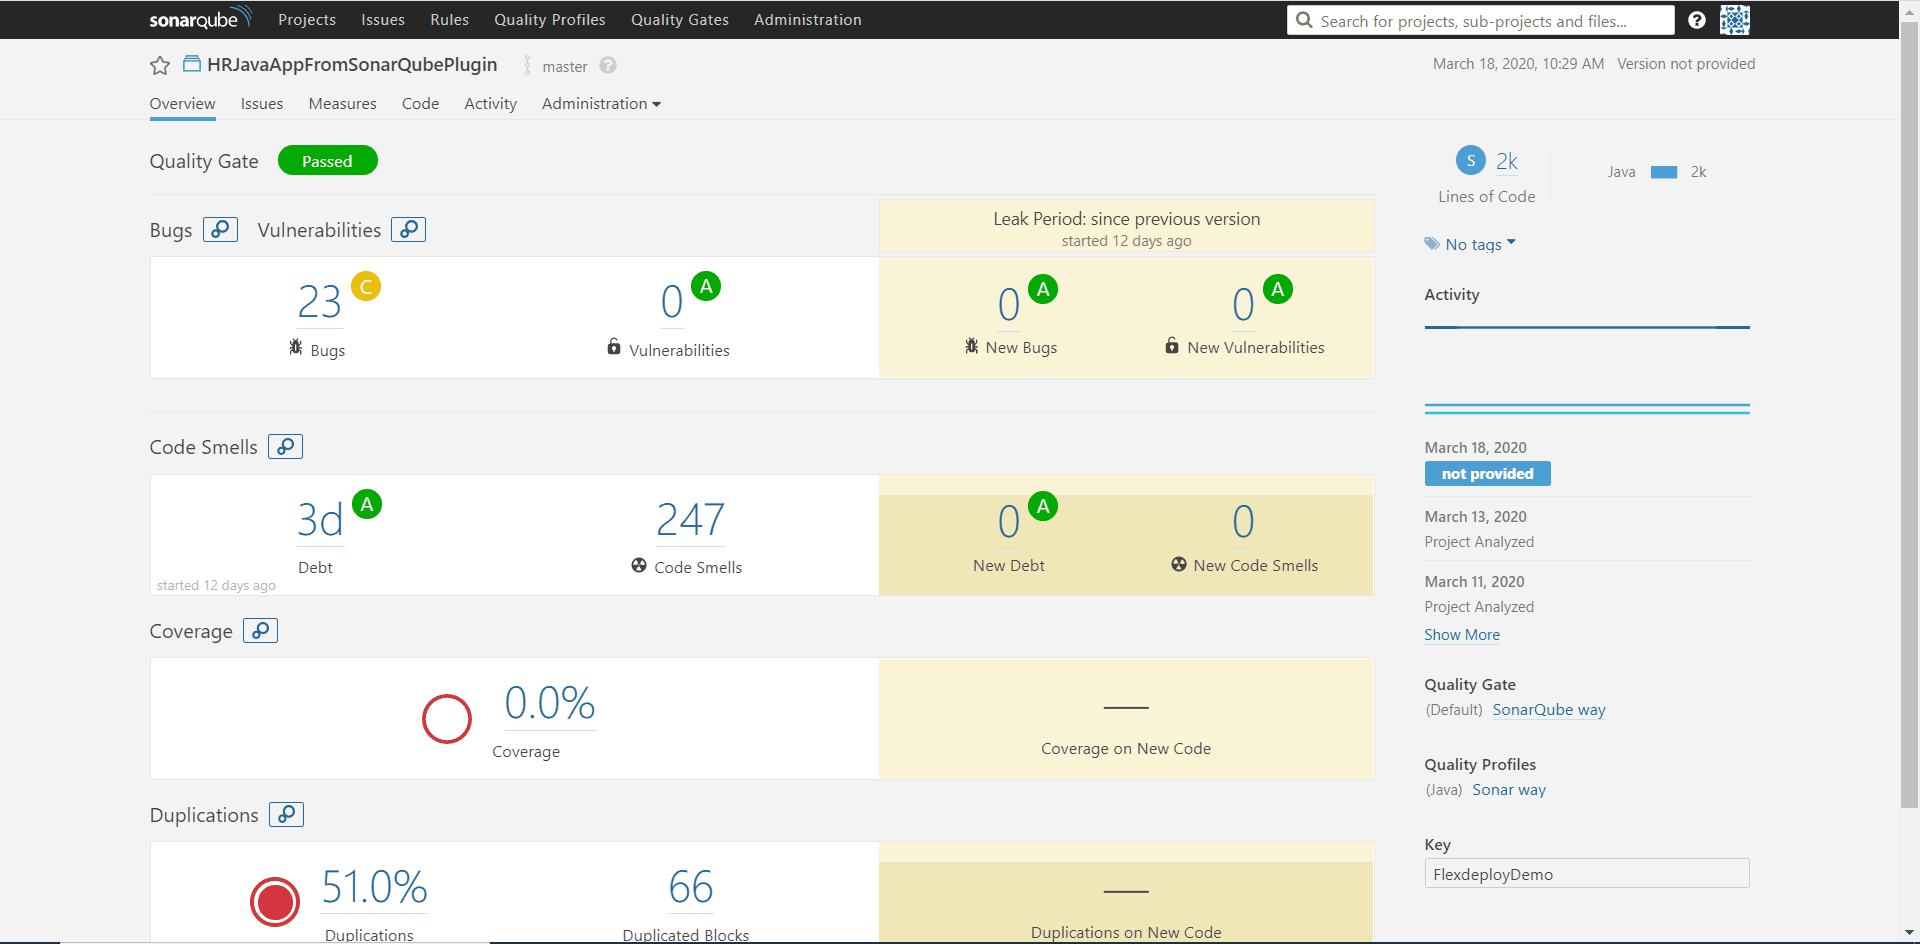
SonarQube Full Report Sample
Here is what you could expect to see on the SonarQube dashboard. On all operations the plugin output “FDSQ_OUT_DASHBOARD_URL” will point you to the report of the scan. On the surface level we have an excellent at-a-glance view of the our project. We can see how many lines of code, bugs, letter grades for each, and some history of previous scans.
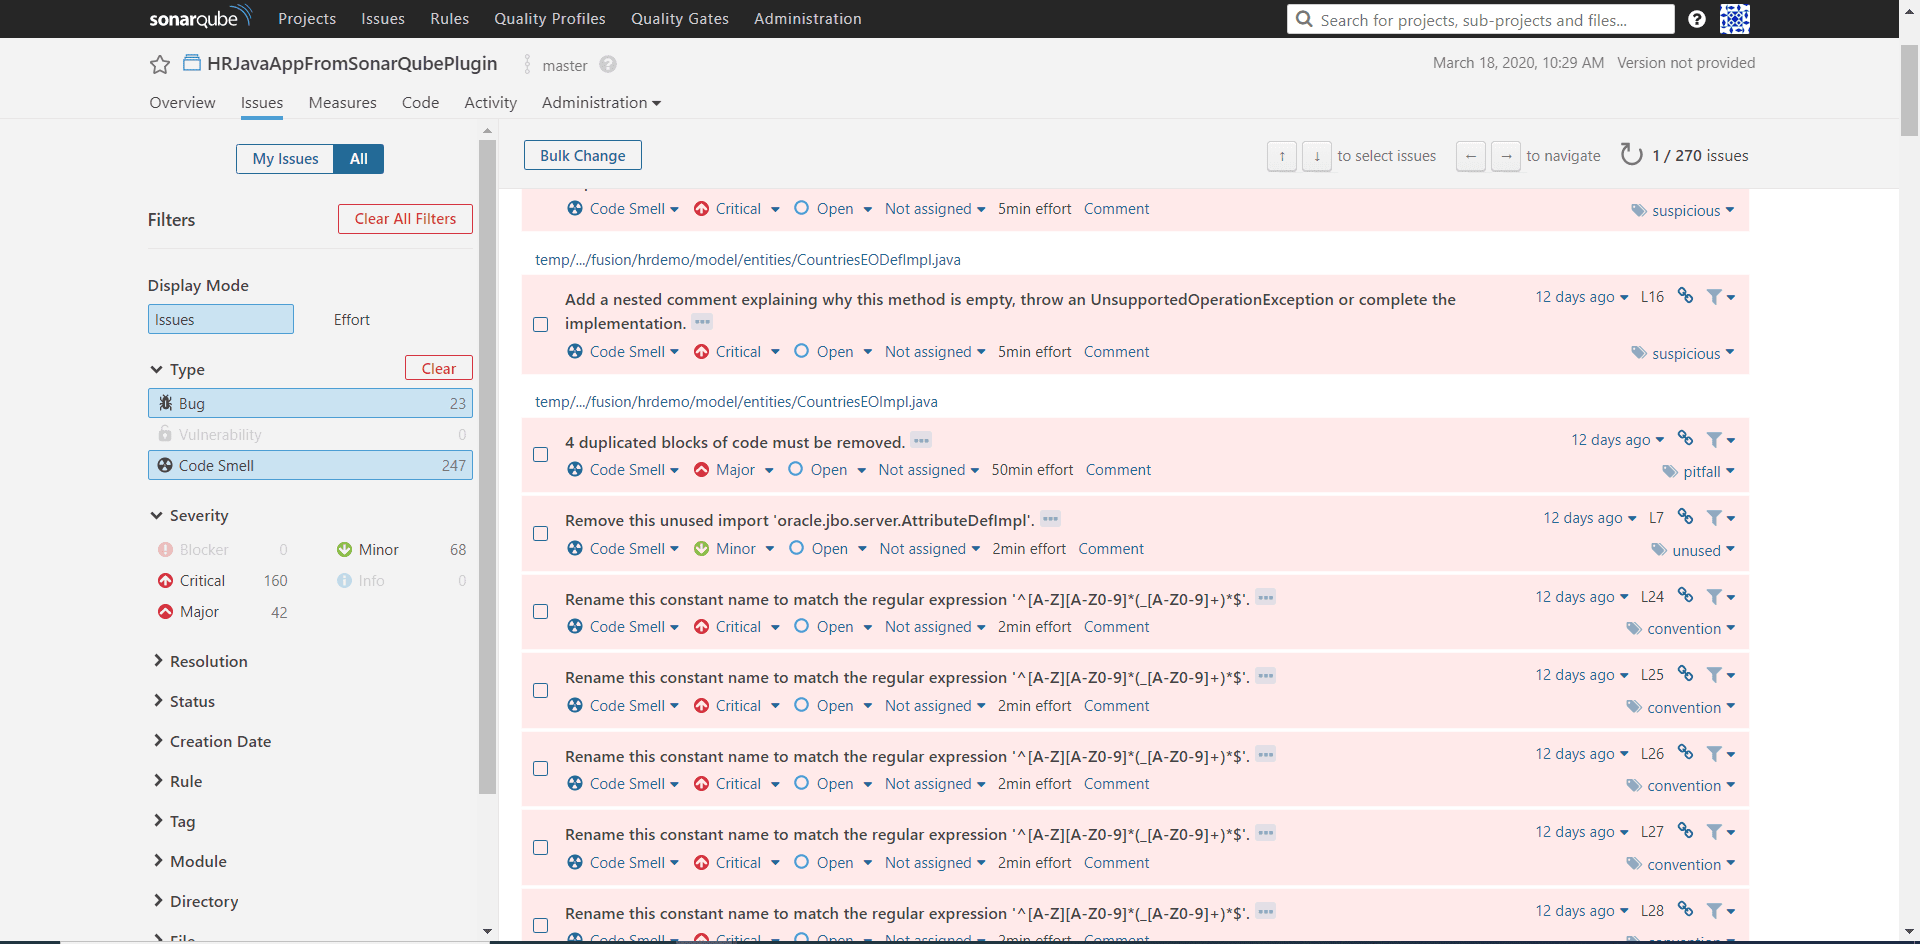
Let’s dive a little deeper into the analysis report by navigating to the Issues tab. Here we can see a detailed run through of each line of code that fails a code rule. You can filter the data by type, severity, coding rule, etc.. This makes it easy and efficient to work through critical errors first or the errors most prevalent for your application. You will also notice the values next to the items under Severity which is how much technical debt you have accrued.
The new SonarQube plugin offers a simple way to integrate SonarQube with your automated CI/CD cycle in FlexDeploy. With this you will be able to identify vulnerabilities earlier and make more informed decisions.