There’s no denying that automated testing plays an important role in an efficient development process. That’s why FlexDeploy allows users to create customized testing tools. By configuring a custom testing tool, users can integrate almost any third-party testing tool with FlexDeploy. Thanks to the FlexDeploy JUnit Plugin, we can now import test results from any testing tool that can generate a JUnit Report! In this guide, we’ll learn how to configure FlexDeploy to run tests and import their results from a tool not natively supported in FlexDeploy.
What we’ll do:
- Create new Testing Tools and Test Types in FlexDeploy.
- Create a Testing Instance in FlexDeploy, reference installation of Testing Tool when necessary.
- Create a Test Definition Workflow for the newly added Testing Tool.
- Configure Test Automation on a project in FlexDeploy to use the new Testing Tool.
- Execute the tests from a project in FlexDeploy.
What we’ll use
- For our external testing tool, we will be using Tricentis Tosca 11.2 (https://www.tricentis.com)
- FlexDeploy JUnit Plugin (JUnit Plugin Guide)
- FlexDeploy 4.6 (https://flexagon.com/flexdeploy/)
Step 1: Creating the Testing Tools and Test Types
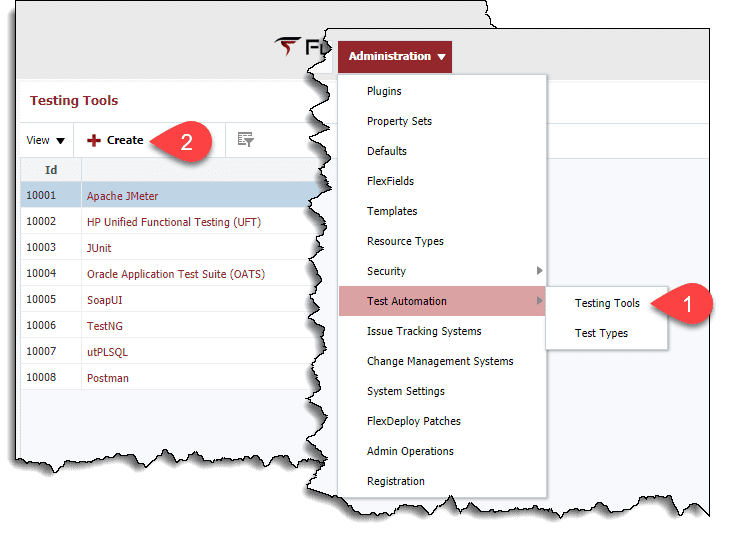
- First, we need to create a new testing tool in FlexDeploy. To do this, we will open the Administration menu in FlexDeploy, then choose Test Automation > Testing Tools. On the Testing Tools screen, click create to start creating a new testing tool.

- On the New Testing Tool screen, we will need to provide a name and define any properties the tool will require. If no properties are required, just give it a name and click save. To define a property, simply click the create button under Testing Tool Properties. In this example I used “Tosca” as the tool name, and then I defined a property for the path to the Tosca CI Client.

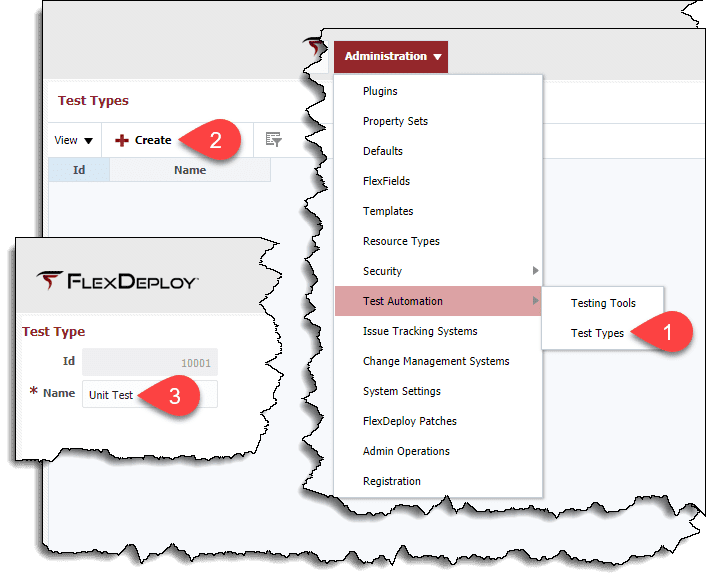
- The next step is going to be creating test types. To do this, we will go to the Test Automation section of the Administration menu again, but this time we’ll choose Test Types. On the Test Types screen, click create, and give a name for the test type we will be running. I’m using “Unit Test”.

Step 2: Creating a Testing Instance
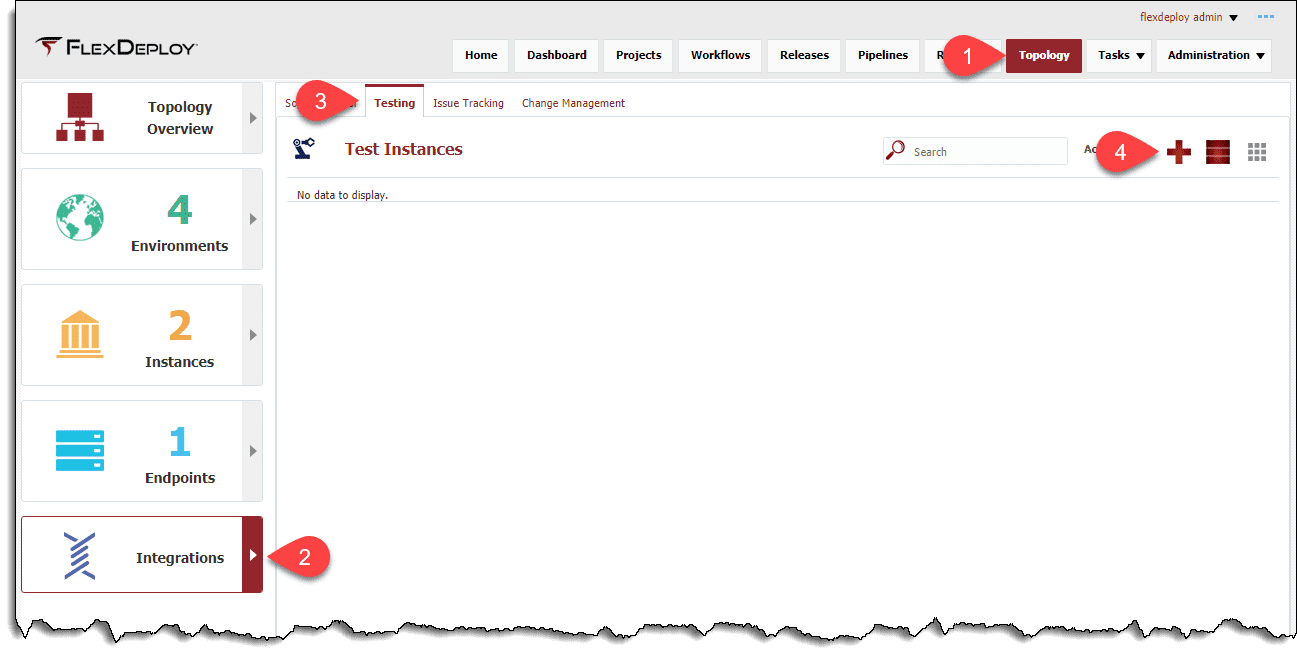
- Now that the testing tool and test type have been created, it’s time to create the testing instance. For this, we’ll go to the Topology Screen and choose Integrations. From here, we will open the Testing tab at the top of the screen. Lastly, click the ‘+’ icon to begin creating a testing instance.

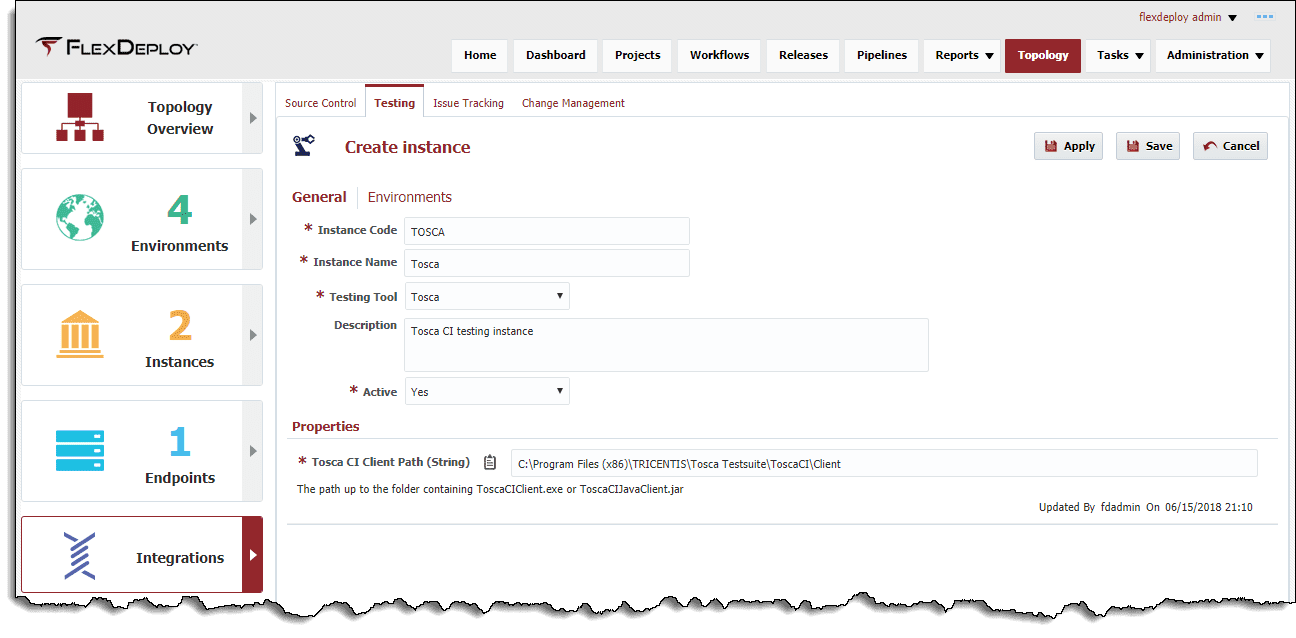
- On the Create Instance screen, we’ll give our instance a meaningful name and code, select the testing tool we created earlier, and enter any properties required by the testing tool. After all the fields are filled in, click Apply, then click on the Environments tab to specify what environments we will be running tests in.

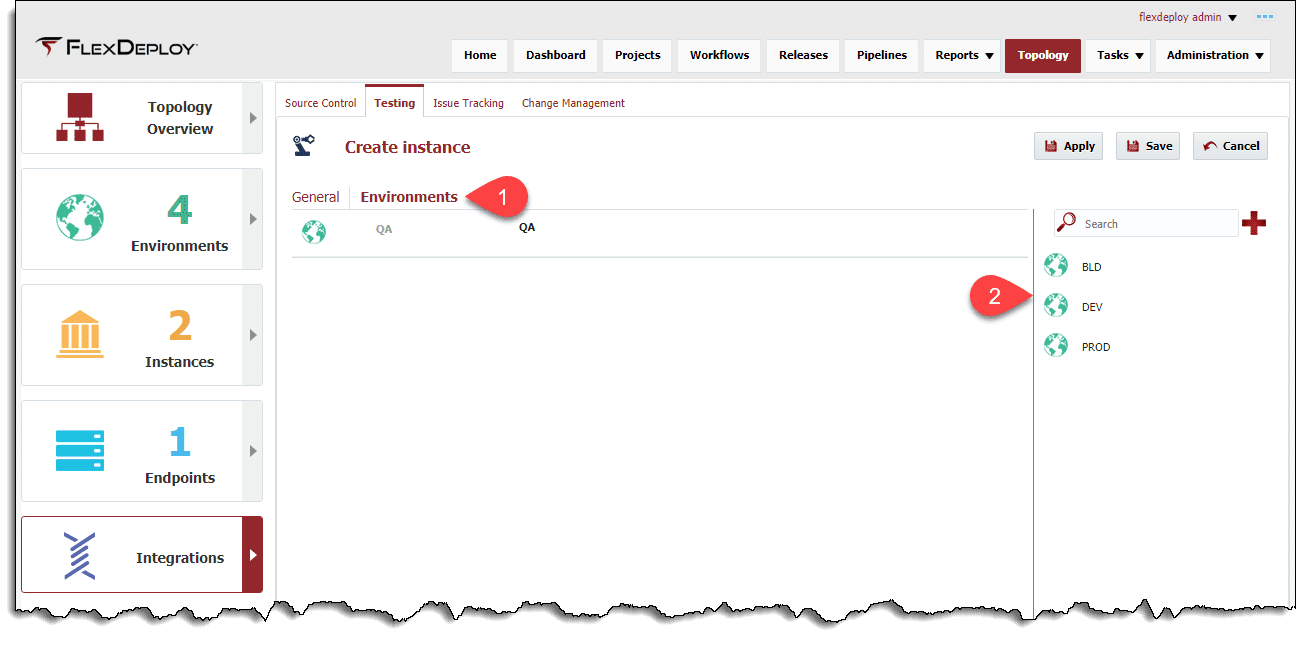
- On the Environments screen, we should add any environment we want to execute these tests in by dragging it from the list on the right into the center of the page. I will be using the QA environment. Finally, after adding environments, press Save. This will bring you back to the Test Instances screen, from here, we will click on the instance again to open it, and select the Environments tab again.

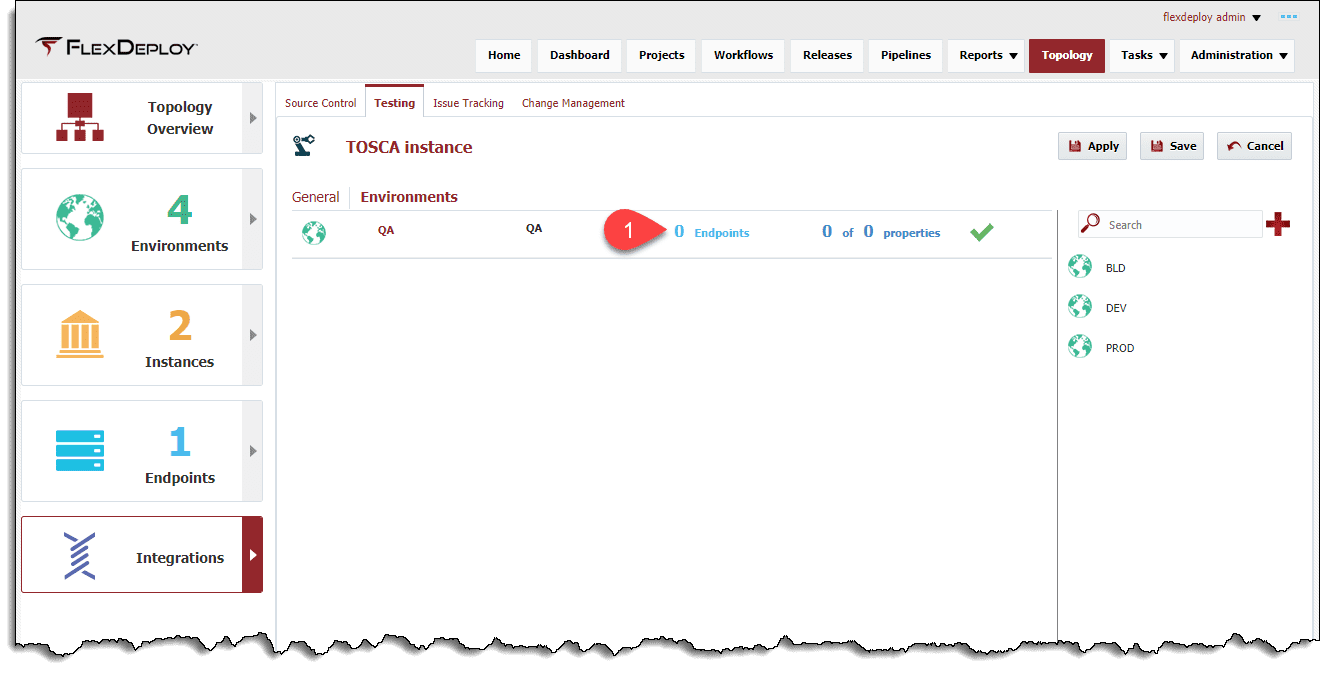
- Back on the Environments screen, we see that there are no endpoints associated with the new Instance, so we will click the Endpoints link, and drag in the endpoint where our tests will be executed. In this example, we’re invoking a command line utility to run the tests, so we need to select an endpoint that has the utility installed.

- Once the Environment/Instance pair has an endpoint associated, press Save. Now we’re done with topology and we can start creating a workflow.
Step 3: Creating a Test Definition Workflow
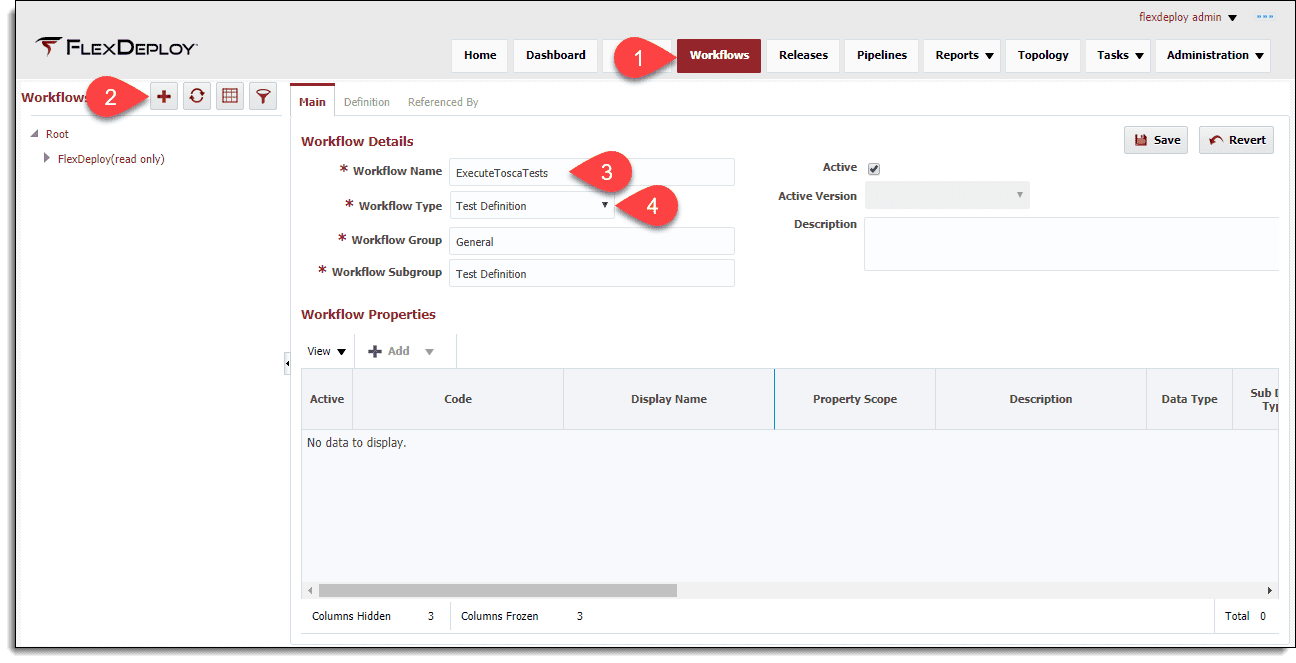
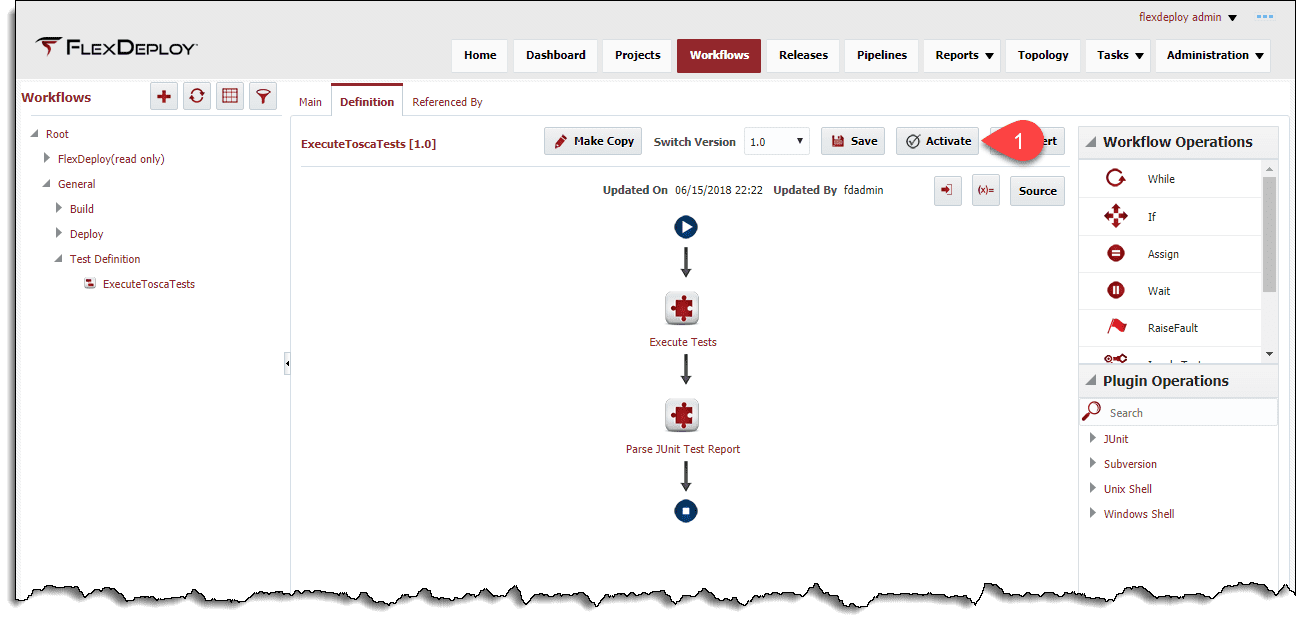
- Now that we’ve got our topology configured, we can start building a Test Definition workflow that will execute tests and parse the results. To start, let’s go to the Workflows screen and click the ‘+’ icon on the left side above the workflow browser. On the new workflow form, we’ll give the workflow a meaningful name, and choose Test Definition from the Workflow Type drop down menu.

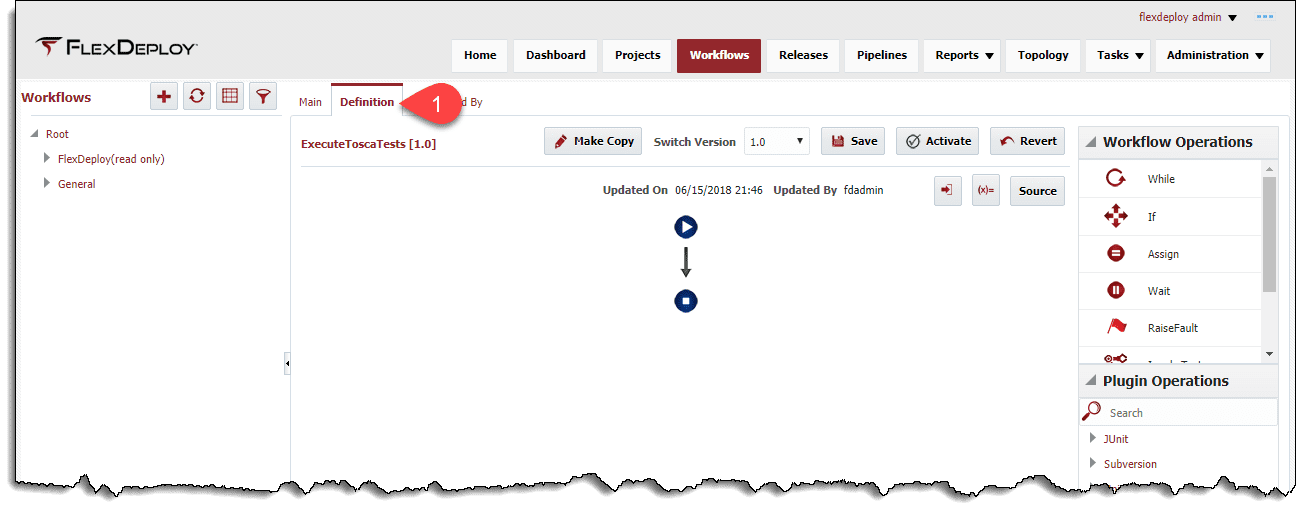
- Click save if you haven’t already, then select the Definition tab at the top of the screen to open the workflow editor.

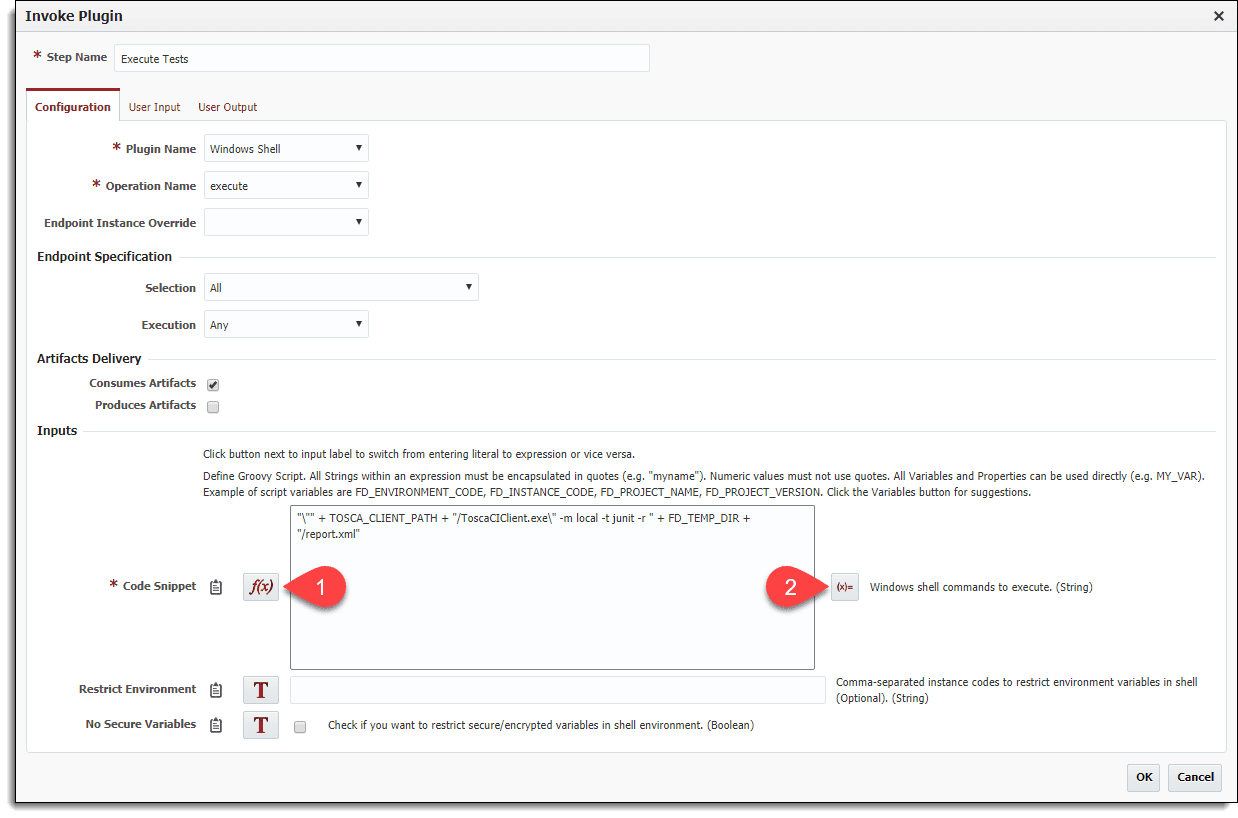
- The testing tool I selected has a command line interface, so this workflow will use the Windows Shell plugin to execute the test. We’ll do this by dragging the execute operation of the Windows Shell plugin onto the canvas. For the Code Snippet input, we’ll first change to script input by pressing the ‘T’ icon. This allows us to easily use the property we defined earlier on the Test Instance.
Note: To find properties easily, with groovy script input enabled, click the ‘(x)=’ icon and start typing the property code.

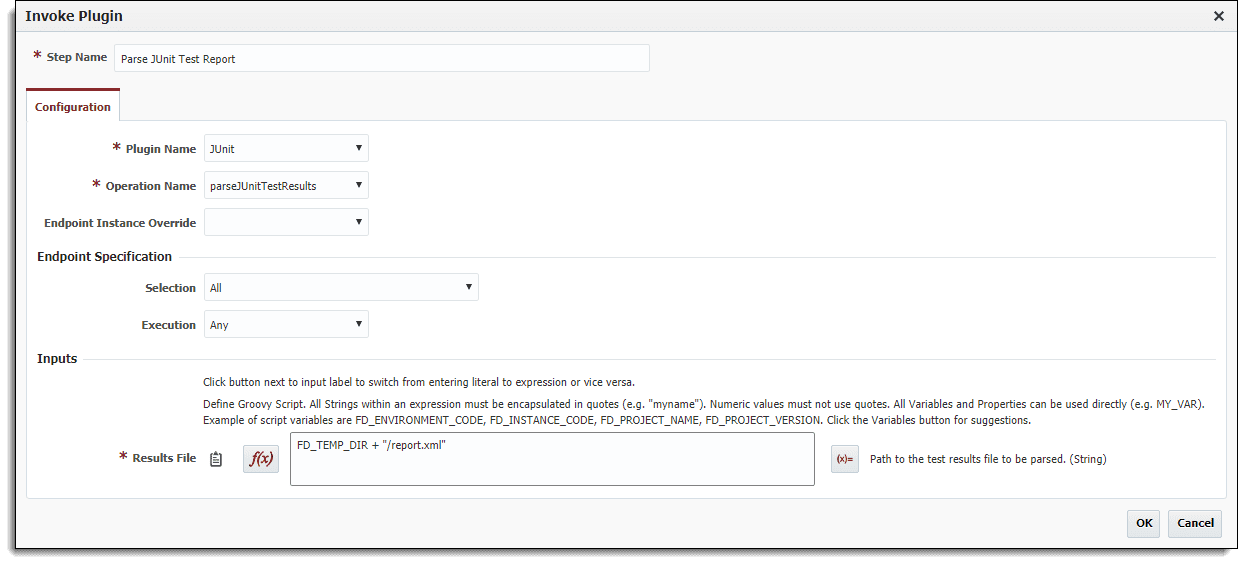
- This testing tool also allows us to format the test output as a JUnit report, so we will also be using the JUnit plugin to parse the test results. This operation only needs the path to a JUnit report XML file. We’ll change the input to groovy script, so we can easily use the FD_TEMP_DIR property to reference the location we specified in the Windows Shell step earlier.

- After configuring the JUnit plugin, our workflow is complete. We just need to activate the workflow, and we’re ready to set up Test Automation on a project.

Step 4: Configuring Test Automation on a Project
- Now that the workflow is activated, we’ll go over to the Projects screen, and open the project we want to set up Test Automation on. The next step is opening the Test Automation tab on the project. Here, we’ll define Test Cases for FlexDeploy to run using the new workflow. First, we’ll configure a Strategy by selecting the Environment and Instance the code we’re testing is deployed to.

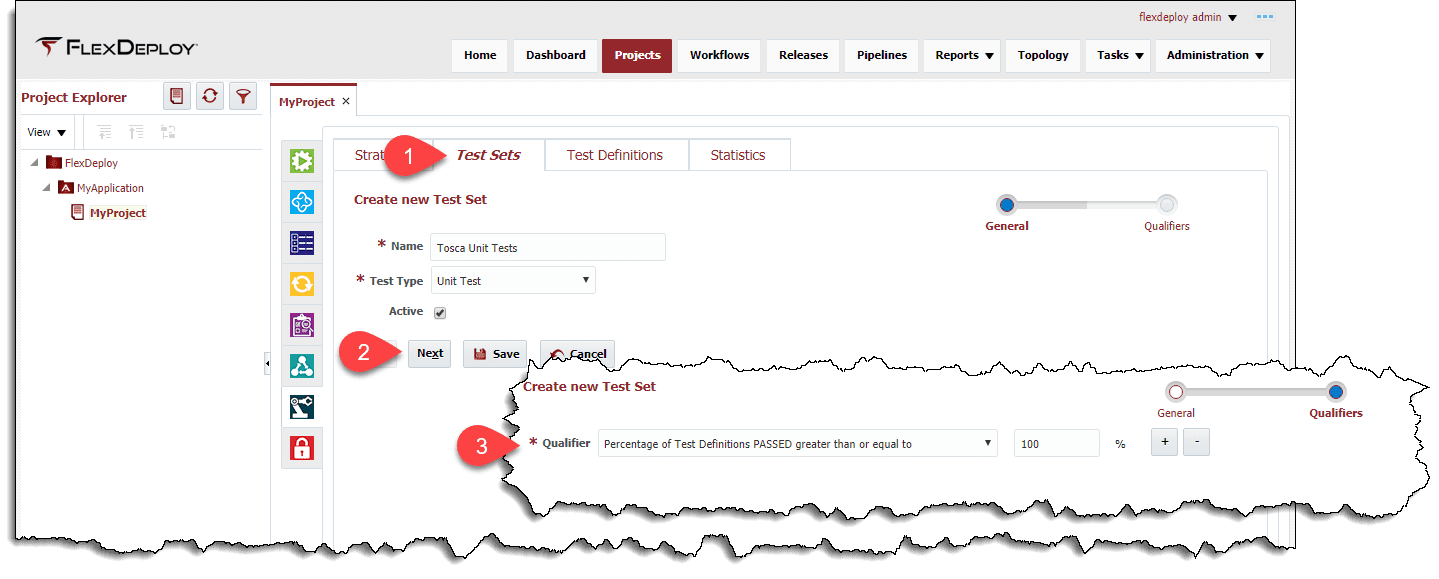
- With the strategy saved, we can create a Test Set to contain our tests. To do this, we open the Test Sets tab, then press create. On the Create new Test Set screen, we give the test set a meaningful name, select a test type, then press Next to go to the qualifiers screen. Qualifiers can be used to set the expected results of the tests being run. If we wanted to allow any failures, we would set that here. For this example, we’ll be expecting all the tests to pass, so we’ll specify that 100% of the tests must pass.

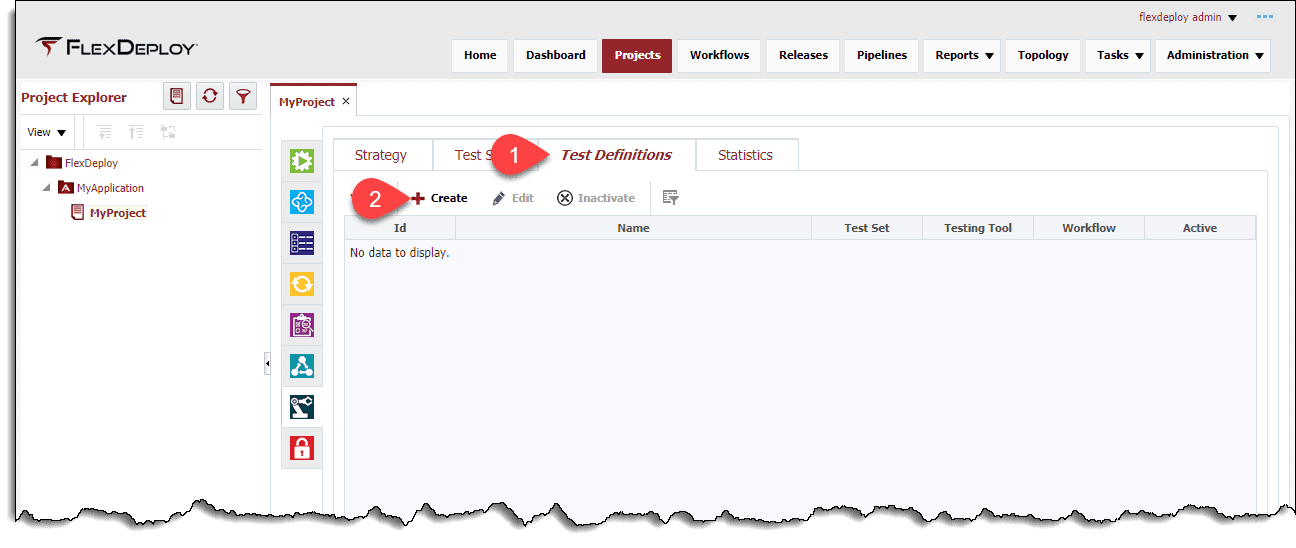
- Now that we have a Test Set, we can create a Test Definition to put in it. To start creating a Test Definition, Open the Test Definitions tab, and click Create.

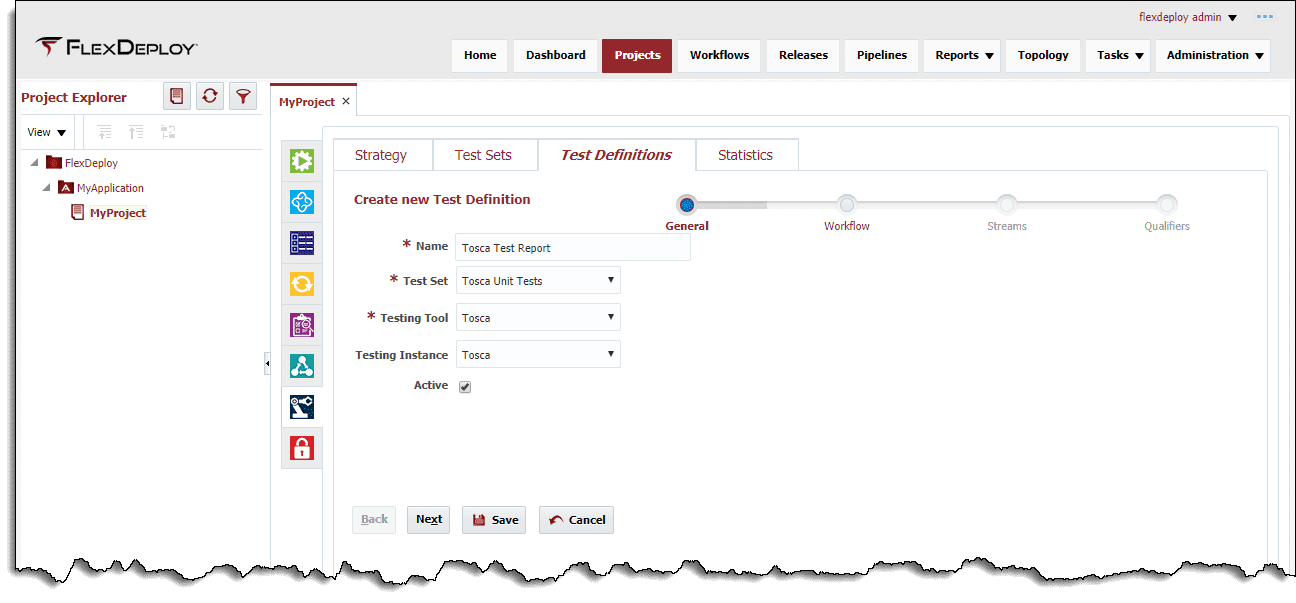
- On the Create new Test Definition screen, we’ll enter a name for the Test Definition and select the Test Set, Test Tool, and Testing Instance. After that, we’ll click Next to move to the Workflow Selection screen.

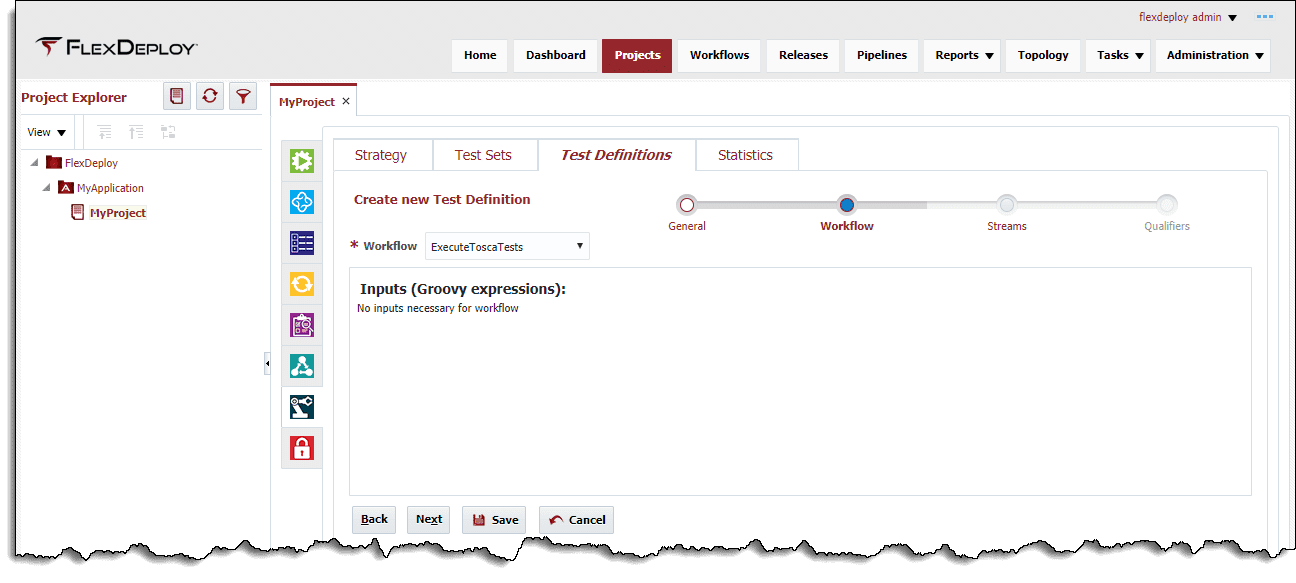
- On the Workflow Selection screen, we choose the workflow we just created and press Next again.

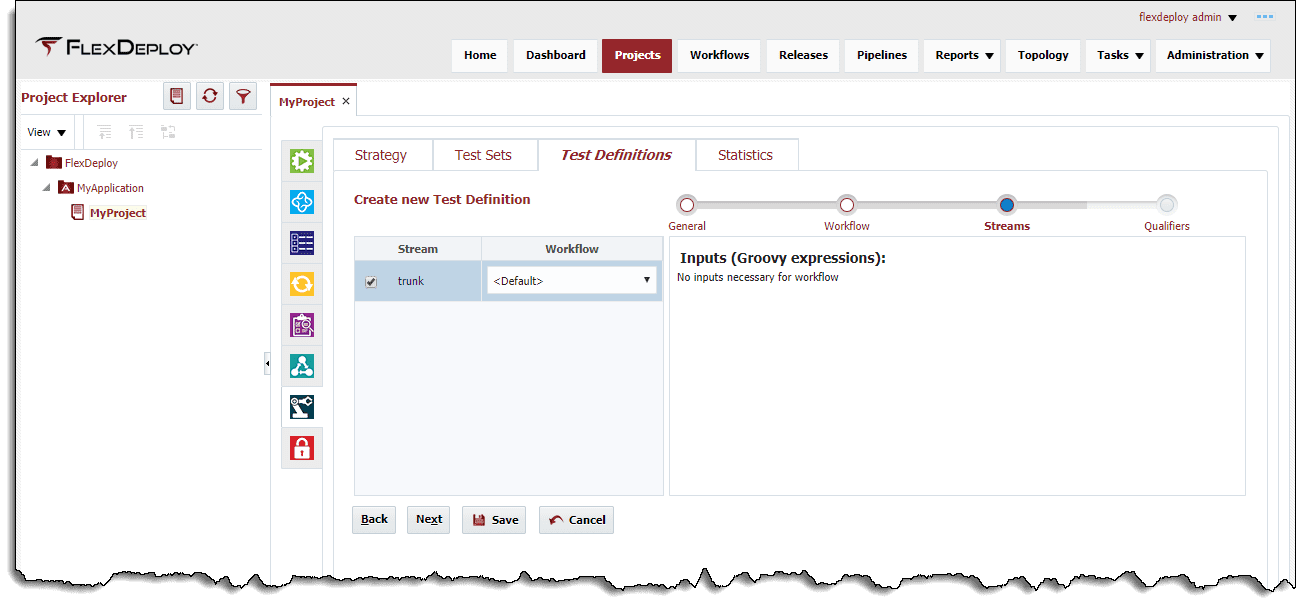
- On the Streams selection, we select what stream we will be executing tests in. We’ll leave these on their default settings and just press Next to go to the Qualifiers screen.

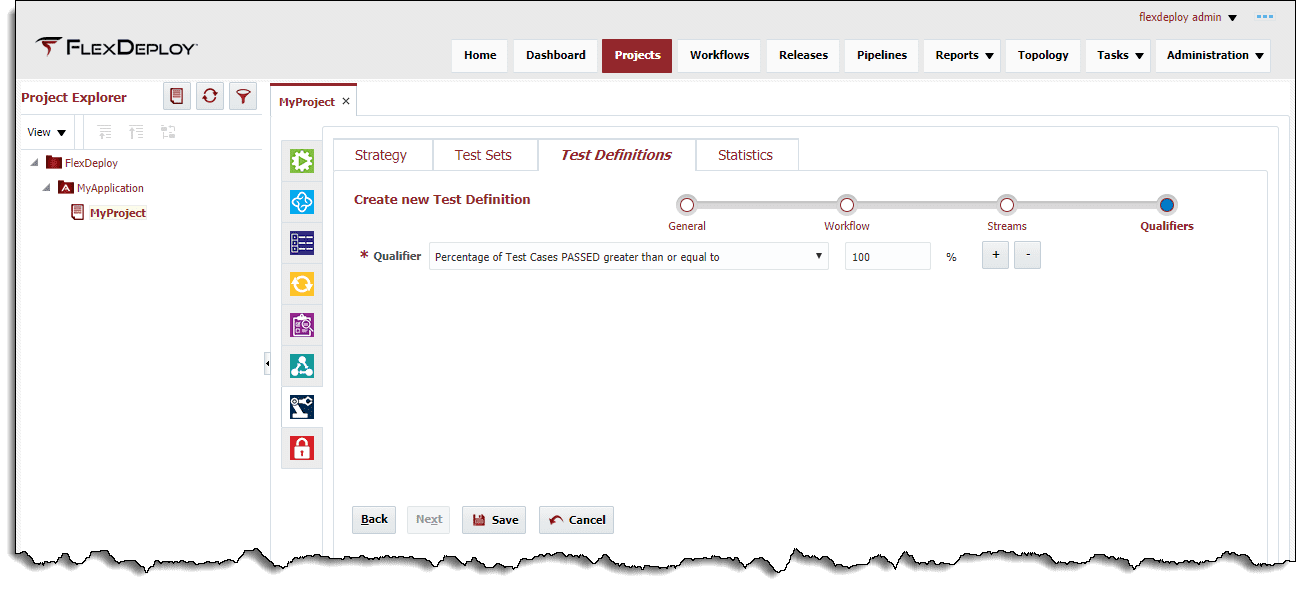
- Here we can set qualifiers the same way we did for the test set. We’ll use the same values as before, because we’re expecting every test to pass.

- Once the qualifiers are set, we can save the Test Definition, and we’re ready to run automated tests on our project.
Step 5: Executing the Tests
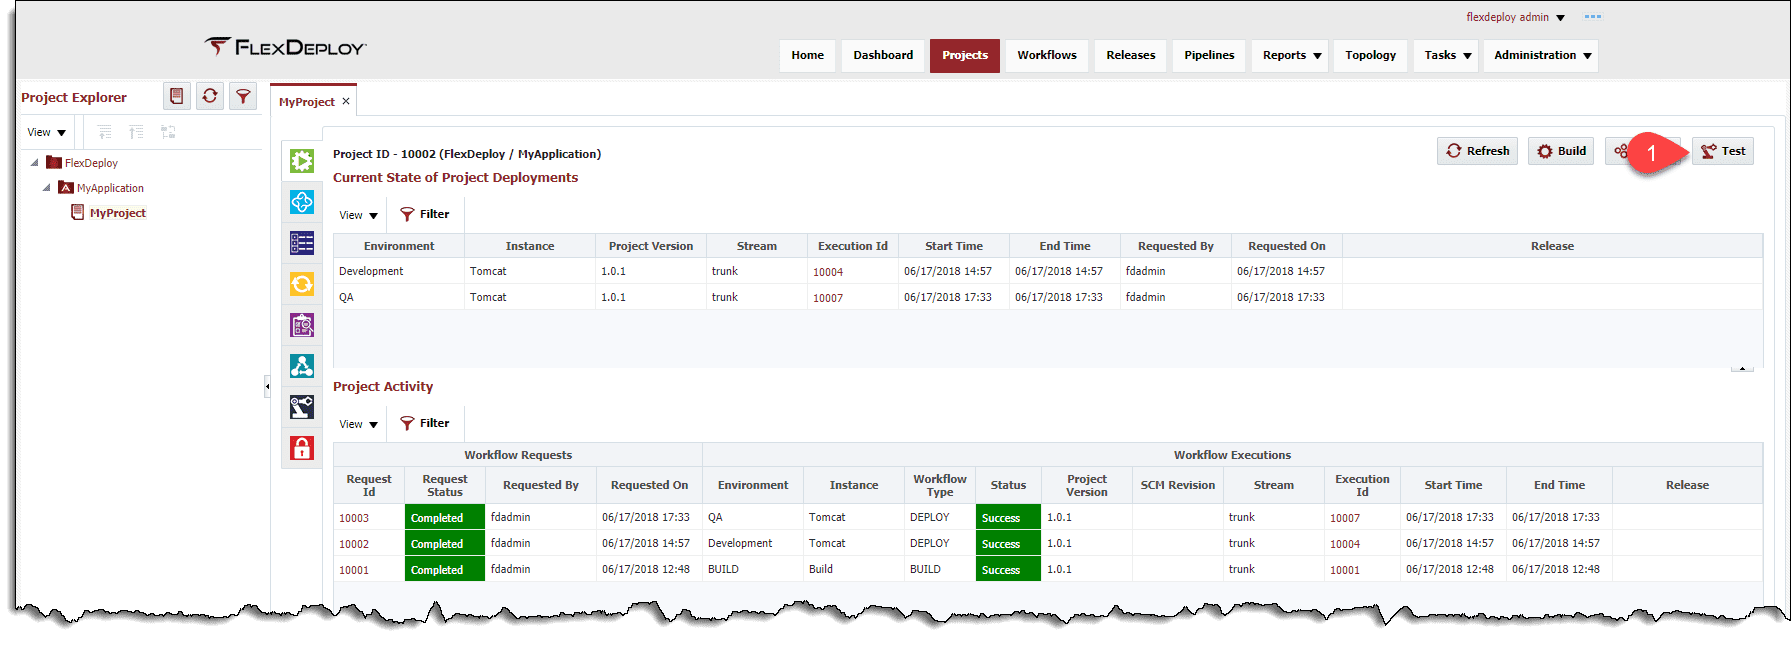
- Now that our tests are configured, we’re ready to run them with FlexDeploy. We’ll go back to the execution tab of the project and make sure we have successfully deployed the project before we run any tests. Once the project has been deployed, we can open the Run Tests Request form by clicking the Test button in the upper right.

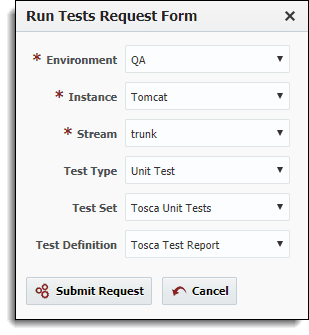
- On the Run Tests Request form, we can select the Environment, Instance, and Stream where we want to run tests. We can also optionally select a Test Type, Test Set, and Test Definition if we only want to execute specific tests. Once all the required selections are made, we click Submit Request to execute the test workflow.

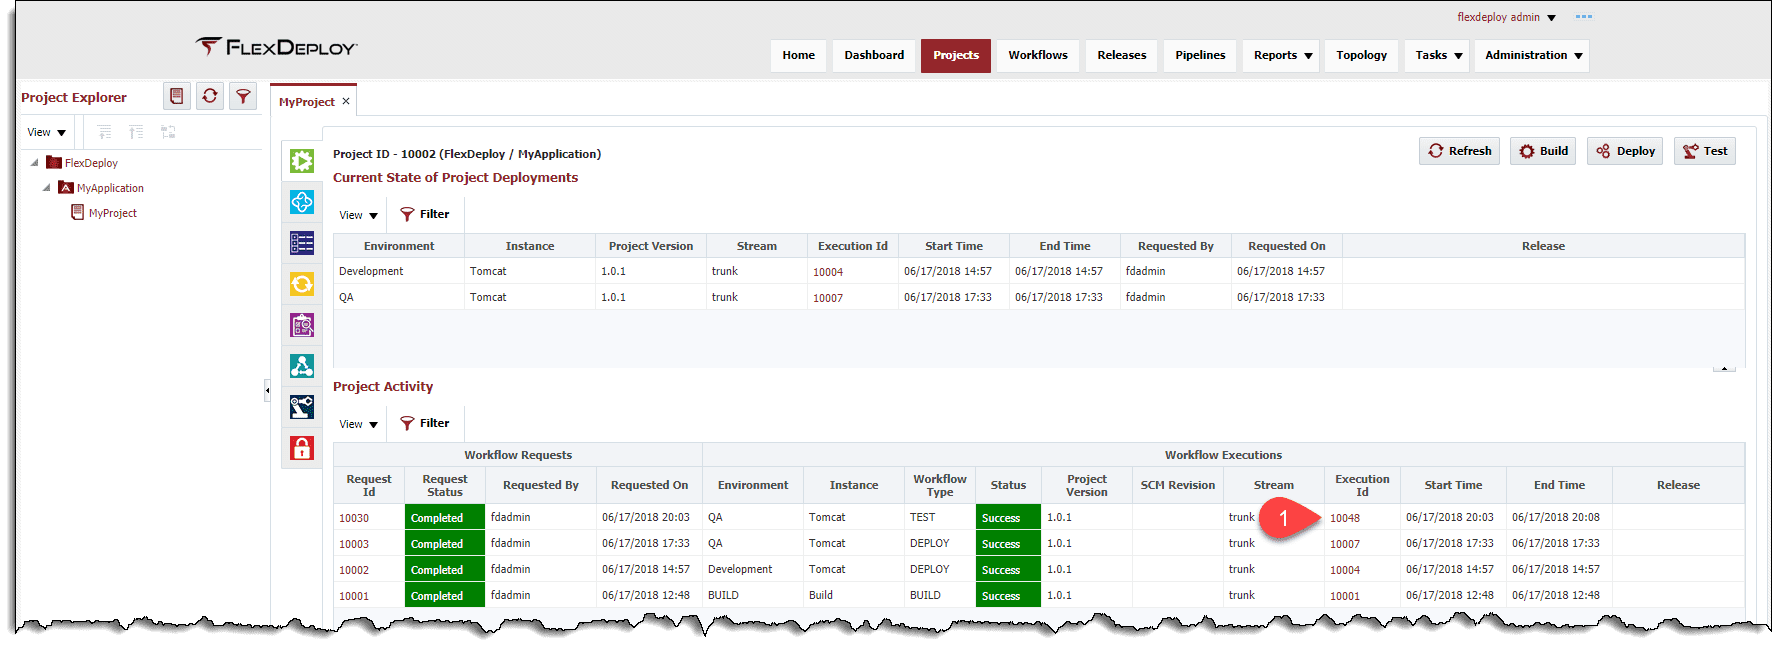
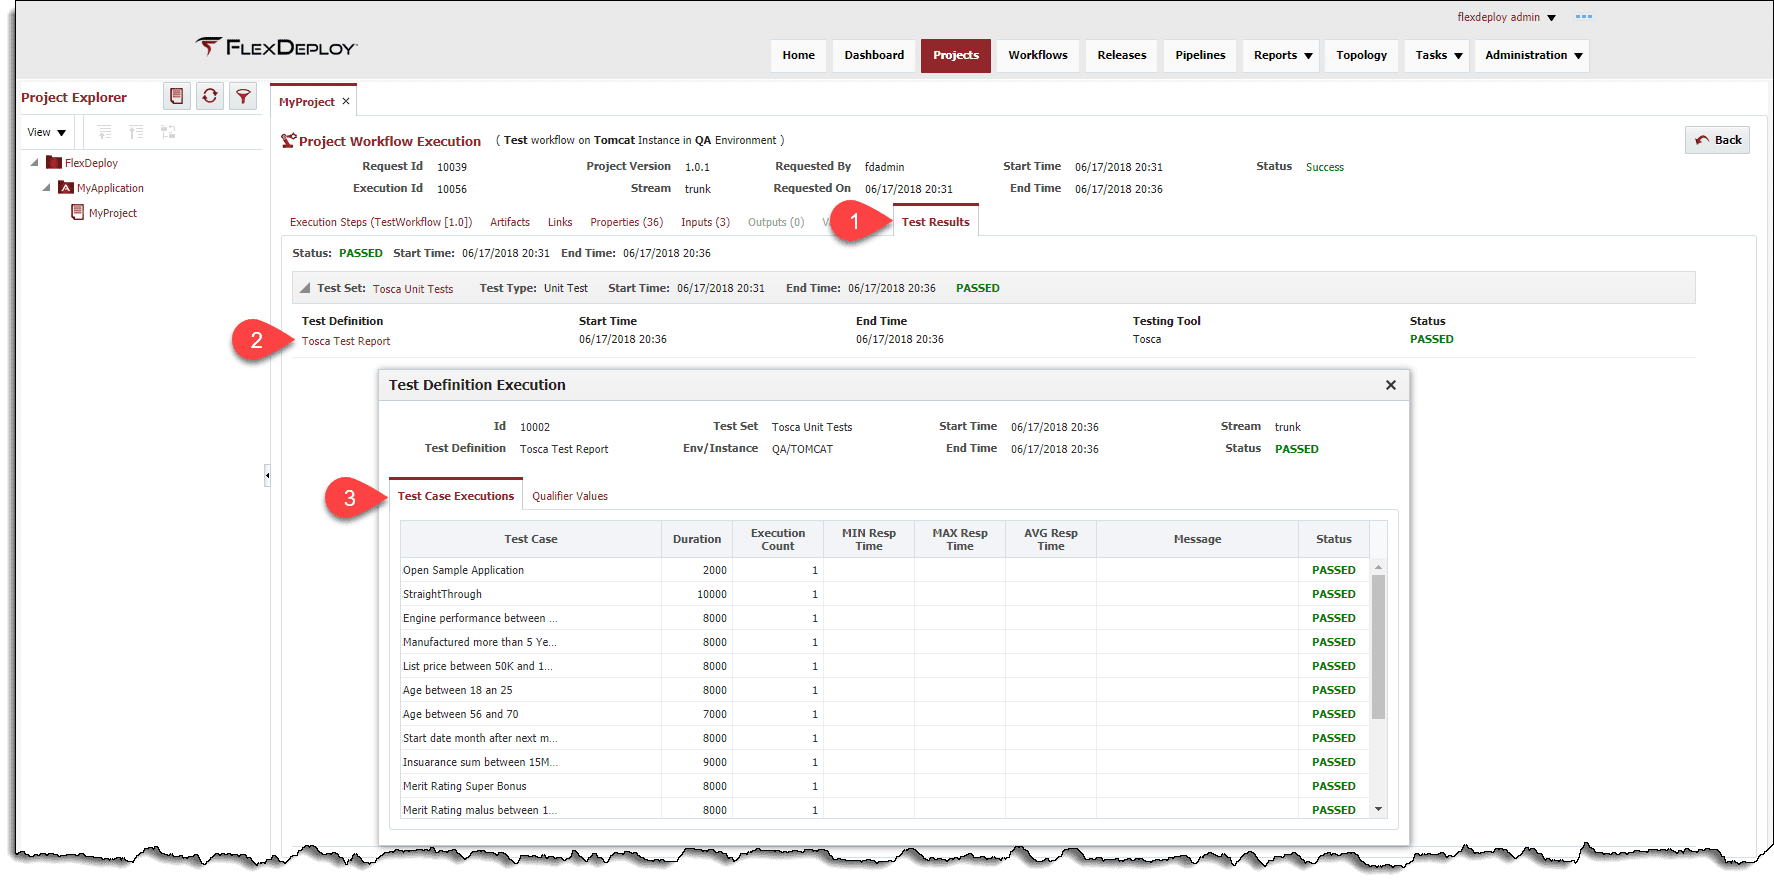
- Once the tests are complete, we should see a successful workflow execution. To view the test results, we can click the workflow execution id to show more information about the test workflow.

- On the Project Workflow Execution Screen, we can open the Test Results tab at the top to see our test results. Here we see our test set, and when we expand the test set, we can see test definition results. Clicking the name of the test definition will open the Test Definition Execution popup, which lists all the test cases executed and information about them.


