
Value Stream Metrics are gaining significant traction when it comes to Continuous Software Delivery, which shouldn’t come as a huge surprise.
You can’t improve what you don’t measure.
– Peter Drucker
Value Stream Metrics track specific checkpoints in the software delivery process that can highlight opportunities for improvement. As a result, companies gain a clear picture of how to increase value to the end customer. FlexDeploy 6.0 makes tracking Value Stream Metrics more visual and streamlined through customizable Dashboards and Project Insights.
DORA Metrics
DevOps Research and Assessment created DORA metrics – a subset of Value Stream Metrics – over the course of 7-years worth of surveys. As a result, DORA Metrics represent the gold standard of Value Stream Metrics. The DORA Metrics consist of four key measurements:
Deployment Frequency
Deployment Frequency is the frequency of deployments to Production. Elite performers in this metric deploy multiple times per day to Production. However this is typically seen in a SaaS environment.
Lead Time for Changes
Lead Time For Changes tracks the time from code commit until that commit is deployed to Production. Elite performers in this category have lead times less than 1 day.
Mean Time to Recovery
Mean Time to Recovery measures the time between a service outage (caused by code deployment) until its ultimate resolution. The elite performers have a mean recovery time of less than 1 hour.
Change Failure Rate
Finally, Change Failure Rate indicates how often code deployments lead to errors in Production. Elite, high, and medium performers all range around 0-15% in this category.
Measuring Value Stream with FlexDeploy
FlexDeploy 6.0 introduces two new features to support data visualization for Value Stream and DORA Metrics: customizable Dashboards and Project insights.
Dashboards
Users now have the ability to customize their own personal Dashboard with a wide selection of panels, including Value Stream and DORA Panels.
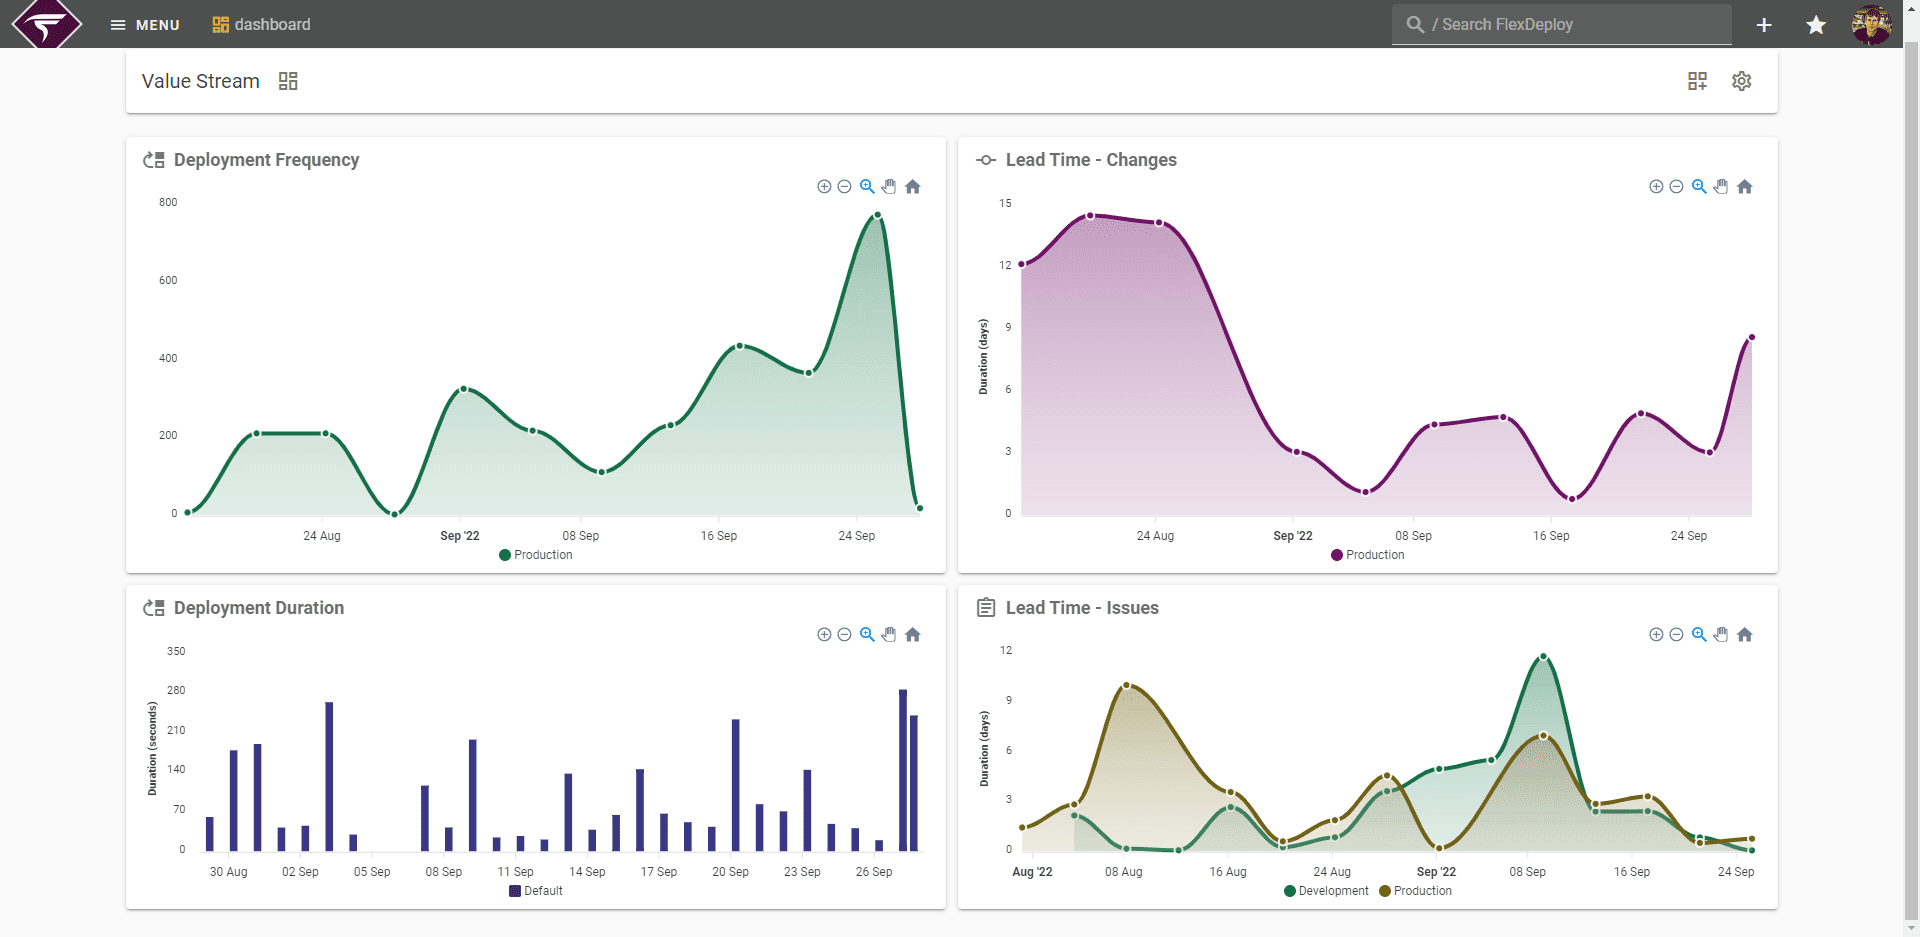
Dashboards support 2 of the 4 DORA Metrics, Deployment Frequency and Lead Time for Changes. Furthermore, every Dashboard can be shared with other Users. For a full feature list of Dashboards and supported Panels check out our Wiki.
Project Insights
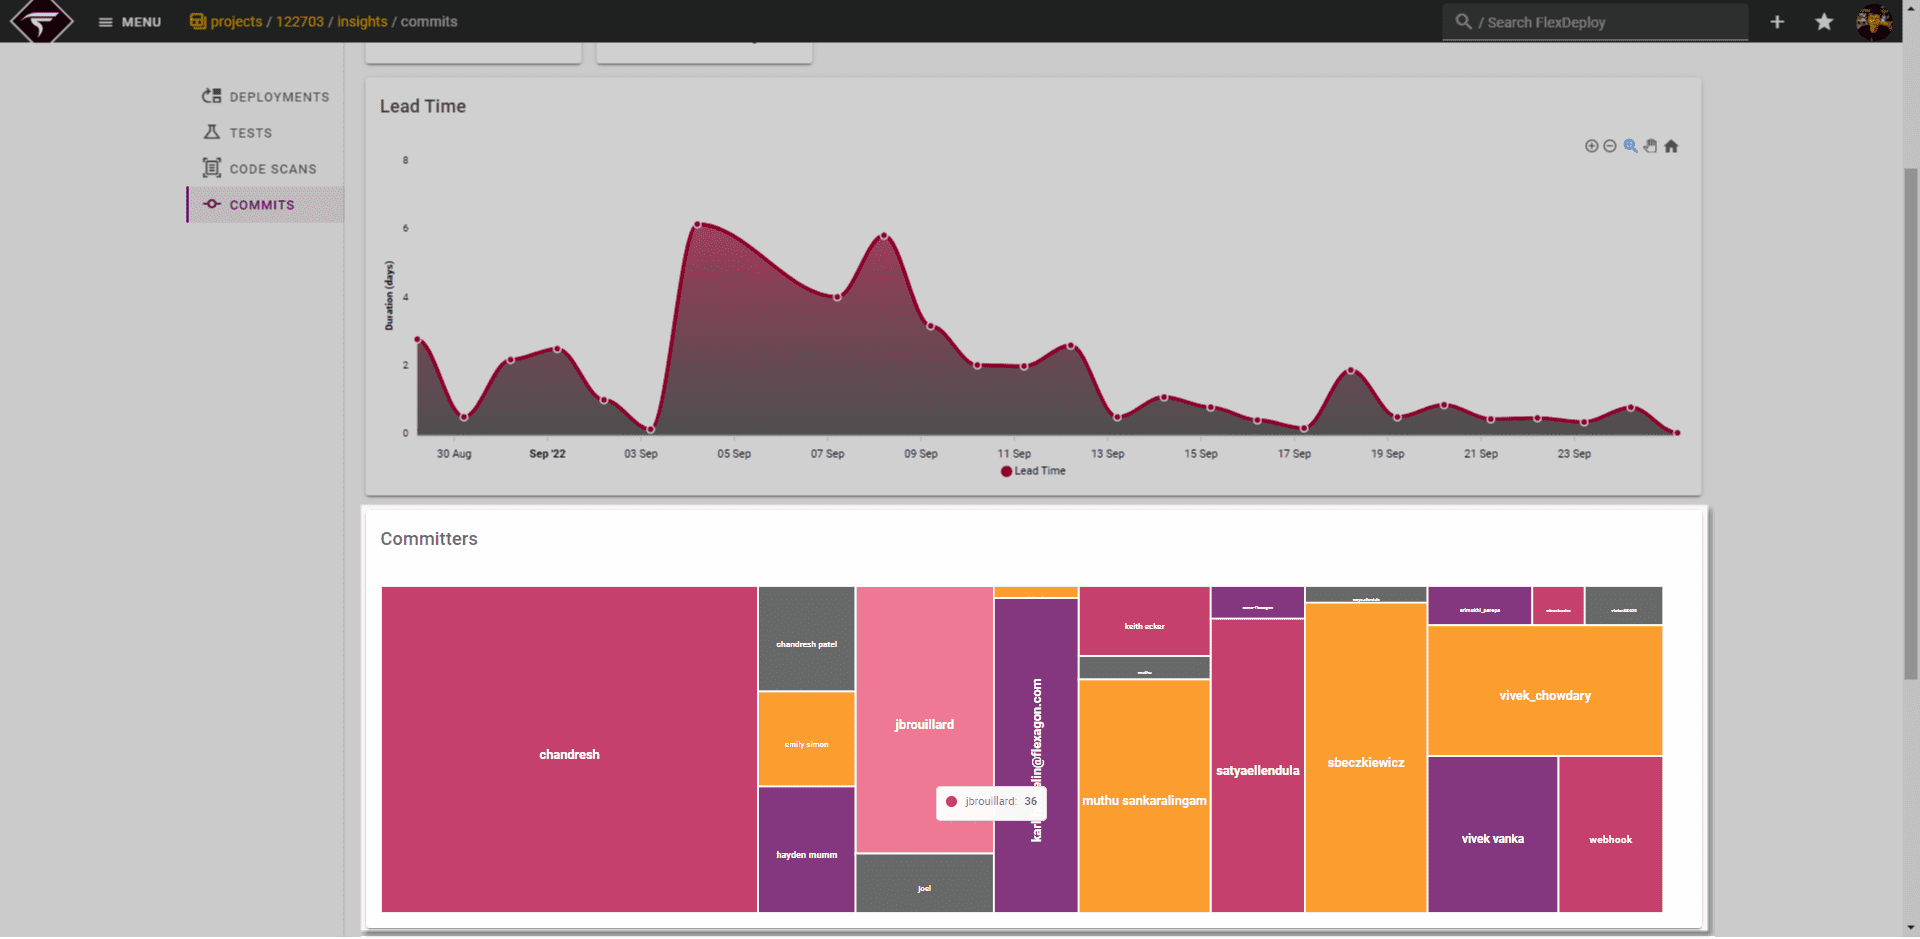
Unlike Dashboards, Project Insights track metrics for specific Projects.
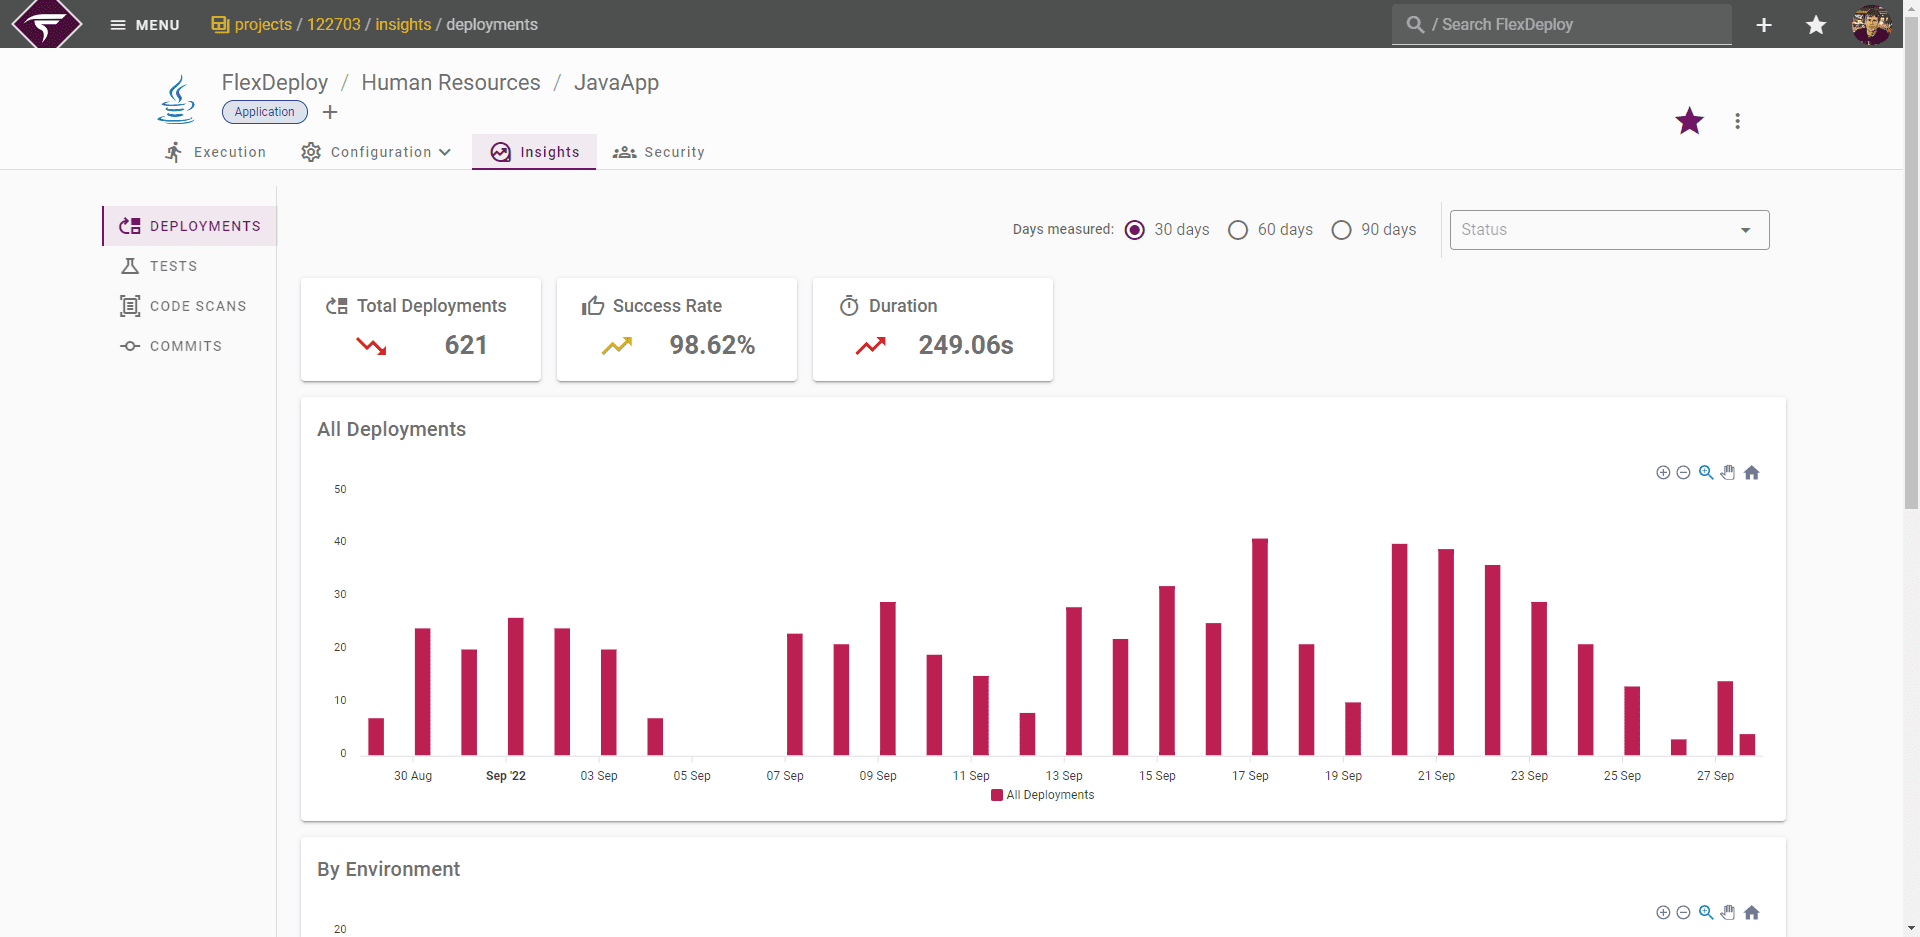
Project Insights are tracked across several categories including: Deployments, Test Automation, Code Scanning and Code Commits. Each category displays a combination of metrics and other useful measurements. For example, Code Commits also shows commit counts grouped by User:
Why you should be tracking Value Stream Metrics
Apart from the obvious reason (charts are cool to look at) there are several reasons you should be tracking Value Stream Metrics if you aren’t already.
- Justifying Decisions – Having quantifiable data showing increases in Deployment Frequency goes a long way when justifying recent hiring or process decisions. Or perhaps bringing in more senior engineers shows a distinct correlation with your Change Failure Rate.
- Knowing the level of value you’re providing – At the end of the day businesses operate to provide value to customers. If you aren’t measuring it – how can you improve it?